Deep Learning Increases the Oil Production by 30% While Reducing CAPEX


Our Measurable Values


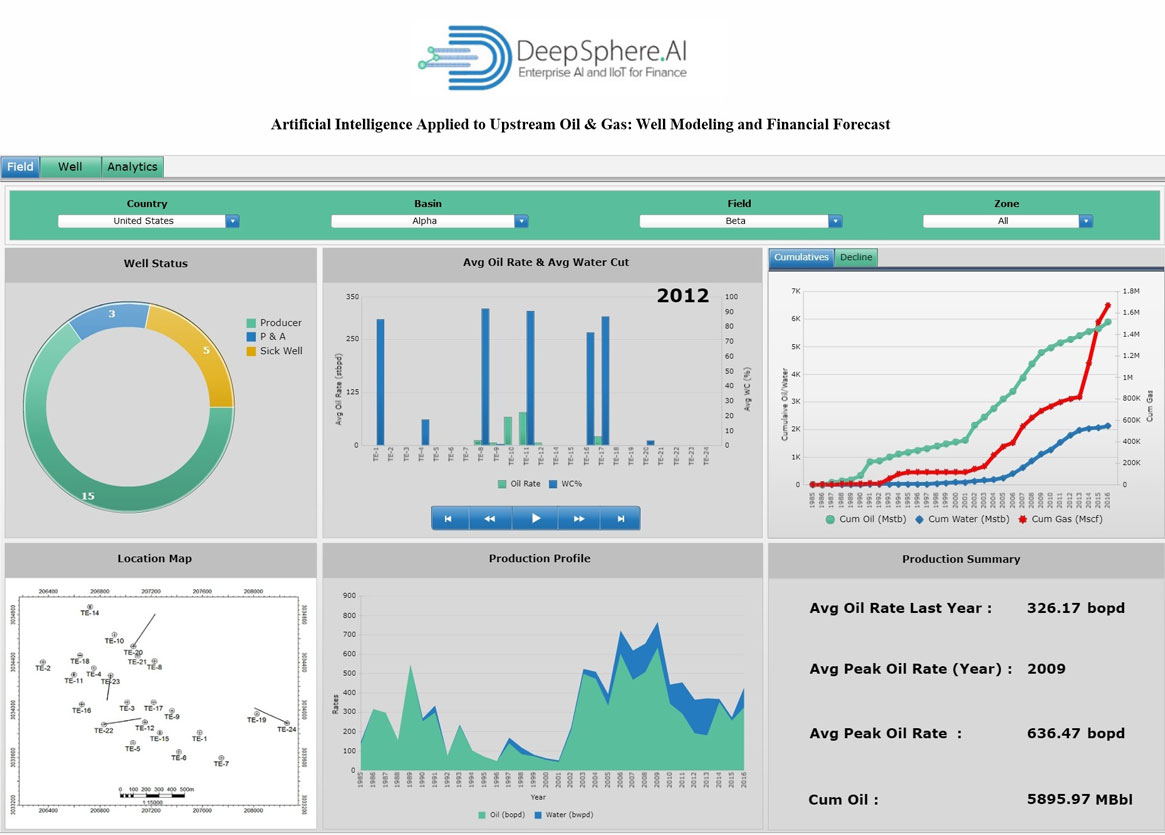
The term “Oil Rate” is defined as means of measuring how many barrels of oil a day a oil well produces. The initial Oil production rate is important because it is used to extrapolate a well’s total production, its peak production level and the rate at which production will decline using a decline- curve analysis. Oil wells typically have an initial production rate that is fairly small compared to peak production because oil production follows a bell curve. However, shale oil wells decline much more rapidly after the initial surge. Production can fall to 50-85% of the IP rate within a year, and to less than 10% of their IP rate after three years.
The production of oil or gas from underground reservoirs involves chemical and mechanical processes that affect the wellbore. Many of these processes can eventually cause a problem with the well, resulting either in a decrease in production or in failure of equipment installed downhole or at the surface. Most of the serious problems can be avoided or delayed through preventive maintenance techniques or early recognition from regular analysis of producing rates, fluids, and the mechanical condition of the well. Such practices can prevent a costly workover that may be required to restore production from the well and may also prevent total loss of the wellbore.
The term “Water Cut” is defined as the ratio of water produced compared to the volume of total liquids produced. The water cut in water drive reservoirs can reach very high values. A well that makes 50 barrels of oil per day and 150 barrels of water a day has a water cut of 150/(50+150) = 75%. Water cuts in producing wells typically increase as oil fields mature with estimated water disposal cost of about $40 billion worldwide.
Managing water production is often the key to optimizing oil production. Water drive provides the driving energy of many oil reservoirs, so water production is inevitable, and a good thing in a way. But water provides no revenue, and actually costs money to separate and dispose. At the point where total costs, including the cost of handling water, exceeds the net revenue from production, the operator is losing money.
Water cut for crude oil flowing in a pipeline can be measured using water-cut meters. Water-cut meters are typically used in the mineral oil industry to measure the water content in oil flowing from a well, produced oil from a separator, crude oil transfer in pipelines and in loading tankers. There are several technologies used. The main technologies are dielectric measurements using radio or microwave frequency.
“Cumulative Oil” is defined as the gross amount of oil production from an oil reservoir over a particular period of time of the life of a well. In general, cumulative production is an Oil and Gas industry term related to an oil well, a basin or an oil field. Cumulative production of oil can be calculated by multiplying the amount of production by the rate. The data gathered from the cumulative production and production rate of an Oil and Gas reservoir is analyzed to keep track of the productive oil wells over a time period, for example a year.
An energy producer extracts oil from a well as long as the field is producing enough amount of Oil and Gas. The company conducts a survey on the field, basin or the well to determine how much Oil and Gas has been produced from it over a specific time span. The gross total of Oil and Gas produced is known as cumulative production, which is calculated by multiplying the rate with the amount of production. Ideally, the cumulative production of all oil reservoirs is calculated annually.
“Cumulative Water” is defined as the gross amount of water production from an oil reservoir over a particular period of time of the life of a well. In general, cumulative production is an Oil and Gas industry term related to an oil well, a basin or an oil field. Cumulative production of water can be calculated by multiplying the amount of production by the rate. The data gathered from the cumulative production and production rate of an Oil and Gas reservoir is analyzed to keep track of the productive oil wells over a time period, for example a year.
An energy producer extracts oil from a well as long as the field is producing enough amount of Oil and Gas. The company conducts a survey on the field, basin or the well to determine how much Oil and Gas has been produced from it over a specific time span. The gross total of Oil and Gas produced is known as cumulative production, which is calculated by multiplying the rate with the amount of production. Ideally, the cumulative production of all oil reservoirs is calculated annually.
“Cumulative Gas” is defined as the gross amount of gas production from an oil reservoir over a particular period of time of the life of a well. In general, cumulative production is an Oil and Gas industry term related to an oil well, a basin or an oil field. Cumulative production of gas can be calculated by multiplying the amount of production by the rate. The data gathered from the cumulative production and production rate of an Oil and Gas reservoir is analyzed to keep track of the productive oil wells over a time period, for example a year.
An energy producer extracts oil from a well as long as the field is producing enough amount of Oil and Gas. The company conducts a survey on the field, basin or the well to determine how much Oil and Gas has been produced from it over a specific time span. The gross total of Oil and Gas produced is known as cumulative production, which is calculated by multiplying the rate with the amount of production. Ideally, the cumulative production of all oil reservoirs is calculated annually.
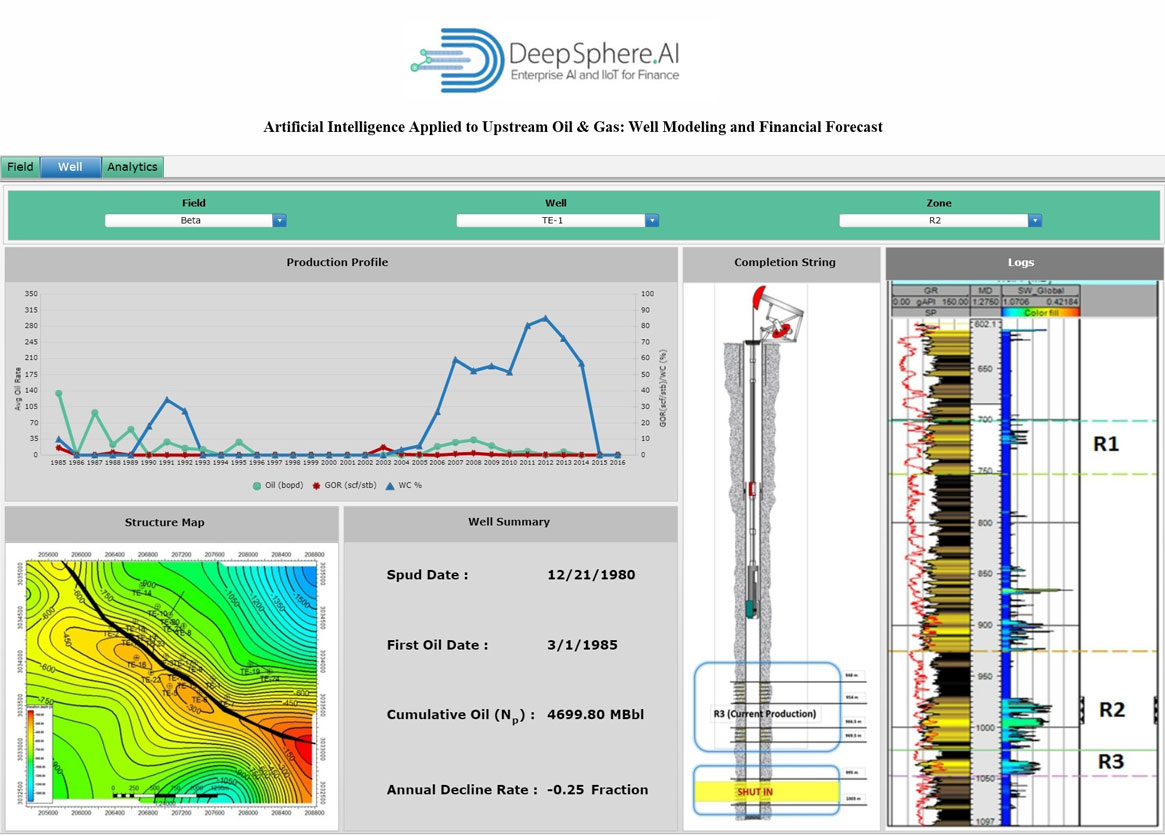
When oil is brought to surface conditions it is usual for some natural gas to come out of solution. The “Gas/Oil Ratio” (GOR) is the ratio of the volume of gas that comes out of solution, to the volume of oil at standard conditions. The Gas/Oil Ratio (GOR) is a dimensionless ratio (volume per volume) in metric units, but in field units, it is usually measured in cubic feet of gas per barrel of oil or condensate. Gas/Oil ratio (GOR) is a measurement typically displayed along with other basic well metadata. It is a determining factor in whether the well is classified as a gas or oil well (as its primary hydrocarbon product).
It is common that both gas and oil will be produced from the same well. For any hydrocarbon mixture produced from an oil production well, the proportion of liquid and vapor phases in the mixture changes with changing temperature and pressure conditions. In order to compare the Gas/Oil Ratio (GOR) from different Oil and Gas samples, the Oil and Gas flow rates must be considered at same temperature and pressure conditions.
Hence the Gas/Oil Ratio (GOR) is always specified at standard temperature and pressure conditions. The liquid and vapor volumetric flow rates are calculated at standard temperature and pressure conditions, expressed in sm3/hr. Sometimes only the gas volume is expressed at standard conditions and liquid volume is expressed in barrels. Then the Gas/Oil Ratio (GOR) is expressed in sm3/bbl.
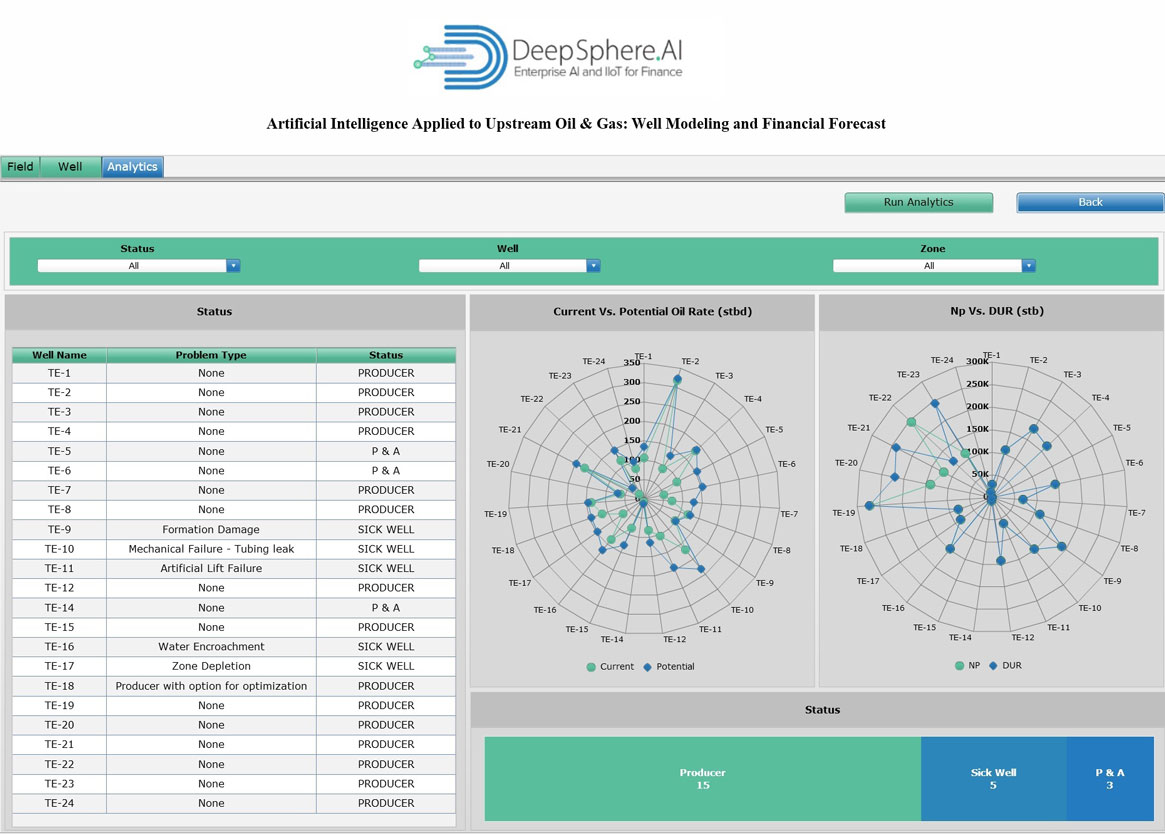
“Current Oil Rate” is defined as the Rate at which the oil well is producing currently. Oil production is the quantities of oil extracted from the ground after the removal of inert matter or impurities. It includes crude oil, natural gas liquids (NGLs) and additives. This indicator is measured in athousand ton of oil equivalent (toe).Crude oil is a mineral oil consisting of a mixture of hydrocarbons of natural origin, yellow to black in colour, and of variable density and viscosity.
NGLs are the liquid or liquefied hydrocarbons produced in the manufacture, purification and stabilisation of natural gas. Additives are non-hydrocarbon substances added to or blended with a product to modify its properties, for example, to improve its combustion characteristics (e.g. MTBE and tetraethyl lead). Refinery production refers to the output of secondary oil products from an oil refinery.
“Potential Oil” Rate is defined as the rate at which the oil well has the maximum capacity of producing oil in the future. Oil production is the quantities of oil extracted from the ground after the removal of inert matter or impurities. It includes crude oil, natural gas liquids (NGLs) and additives. This indicator is measured in thousand ton of oil equivalent (toe). Crude oil is a mineral oil consisting of a mixture of hydrocarbons of natural origin, yellow to black in colour, and of variable density and viscosity.
NGLs are the liquid or liquefied hydrocarbons produced in the manufacture, purification and stabilisation of natural gas. Additives are non-hydrocarbon substances added to or blended with a product to modify its properties, for example, to improve its combustion characteristics (e.g. MTBE and tetraethyl lead). Refinery production refers to the output of secondary oil products from an oil refinery.
“Net Production” (Np) is defined as amount of oil and/or gas a well generates that is owned and available for distribution after taxes, royalties, expenses are paid. Oil production is the quantities of oil extracted from the ground after the removal of inert matter or impurities. It includes crude oil, natural gas liquids (NGLs) and additives. This indicator is measured in thousand ton of oil equivalent (toe).Crude oil is a mineral oil consisting of a mixture of hydrocarbons of natural origin, yellow to black in colour, and of variable density and viscosity.
NGLs are the liquid or liquefied hydrocarbons produced in the manufacture, purification and stabilisation of natural gas. Additives are non-hydrocarbon substances added to or blended with a product to modify its properties, for example, to improve its combustion characteristics (e.g. MTBE and tetraethyl lead). Refinery production refers to the output of secondary oil products from an oil refinery.
Ultimate Recovery, also known as “Discovered Ultimate Recovery (DUR)”, is the total ultimate discovered recovery of oil or gas from a reservoir rock by the end of its producing life. These estimated recoverable values from a reservoir are generally approximate values derived from various mathematical models and units depending on the study being conducted. E&P organizations must factor ultimate recovery in order for the production project to be viable and profitable.
The Ultimate Recovery or Discovered Ultimate Recovery (DUR) value represents the rough possible quantity of hydrocarbons recoverable from an oil well. These values help decision makers to decide whether the project would be economically viable or not for the E&P organization. Thus, based on the DUR figures and certain other parameters, the organization can decide whether they should invest into the development of an oil or gas well on a particular hydrocarbon reservoir on which studies are being conducted.
During project execution phase in the Oil and Gas E&P business, one important parameter check needs to be performed, i.e., the drilling project should meet an acceptable discovered ultimate recovery (DUR) threshold value in order for the well drilling to proceed.
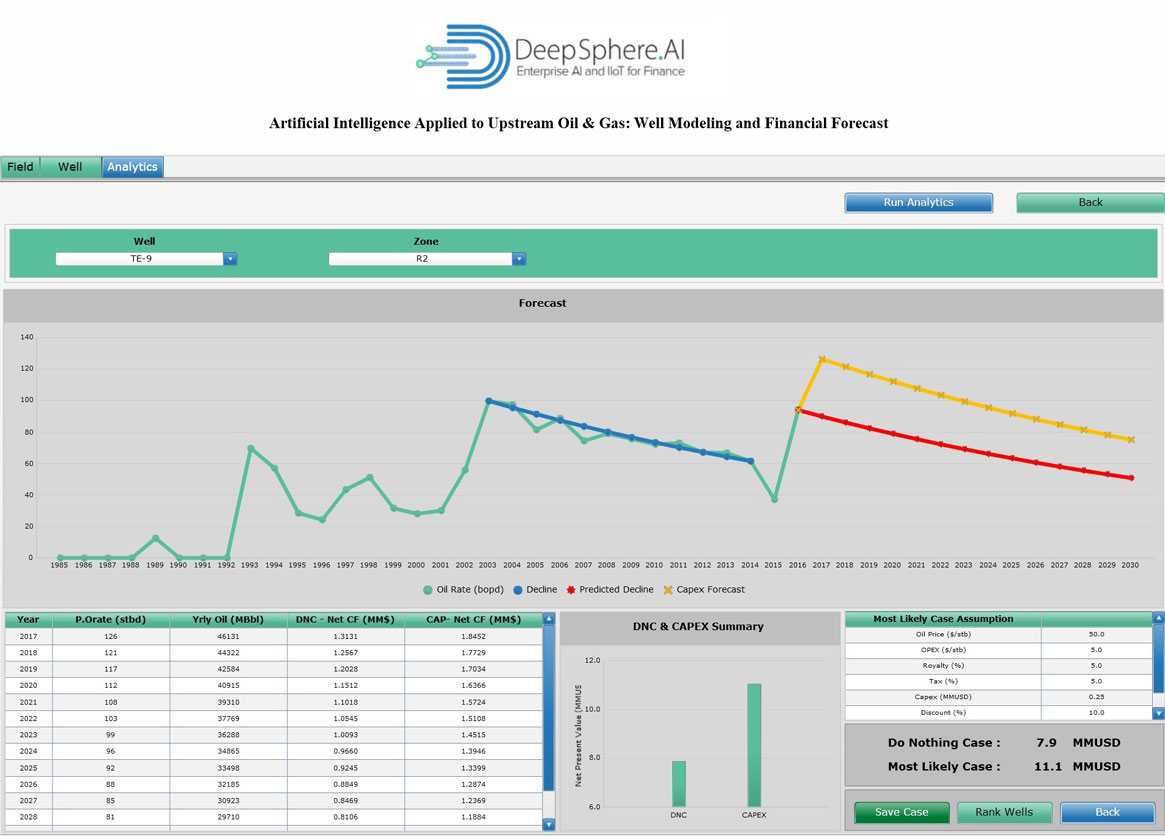
The term “Decline Rate” is the rate at which the production is declining. Decline Rate refers to the annual reduction in the rate of production from an individual field or a group of fields, after a peak in production. Detailed empirical analyses of decline rates have been produced for well over 50 years and most studies tend to agree on the typical decline rates for different categories of field, despite some differences in details.
Decline curve analysis (DCA) is a graphical procedure used for analyzing declining production rates and forecasting future performance of Oil and Gas wells. Oil and gas production rates decline as a function of time; loss of reservoir pressure, or changing relative volumes of the produced fluids, are usually the cause. Fitting a line through the performance history and assuming this same trend will continue in future forms the basis of DCA concept. It is important to note here that in absence of stabilized production trends the technique cannot be expected to give reliable results.
The decline curve is a method for estimating reserves and predicting the rate of oil or gas production. It typically shows the pace at which production is expected to decline over the lifetime of an energy asset. Knowing the decline curve can help a producer estimate the quantity of oil reserves that can come from a well over its lifetime, the present and future value of a well, and the rate at which assets should depreciate on a company’s books. In aggregate, the decline curve can also help determine the rate of production for a total reservoir or even multiple reservoirs.
The term Oil and Gas “Capital Expenditure, or CAPEX,”is financing used by companies to secure physical assets or upgrade current assets. CAPEX generally takes two forms; maintenance expenditure, in which a company purchases assets that extend the useful life of existing assets, and expansion expenditure, in which a company purchases new assets in an effort to grow the business.
CAPEX is basically capital expenditures such as drilling & completing a well. It’s a critical component to capital budgeting and should be monitored well. Capital Expenditures incurred in exploration activities should be expensed unless they meet the definition of an asset. An entity recognizes an asset when it is probable that economic benefits will flow to the entity as a result of the expenditure. The economic benefits might be available through commercial exploitation of hydrocarbon reserves or sales of exploration findings or further development rights. It is difficult for an entity to demonstrate that the recovery of exploration expenditure is probable. Where entities do not adopt IFRS 6 and instead develop a policy under the Framework, expenditures on an exploration property are expensed until the capitalization point.
The term Oil and Gas “Net Cash Flow,”is the difference between a company's cash inflows and outflows in a given period. In the strictest sense, net cash flow refers to the change in a company's cash balance as detailed on its cash flow statement. One can approximate a company's net cash flow by looking at the period-over-period change in cash on the balance sheet. However, the statement of cash flows is a more insightful place to investigate. Net cash flow is the sum of cash flow from operations (CFO), cash flow from investing (CFI), and cash flow from financing (CFF).
Net Cash Flow is most commonly used model in the Oil and Gas industry to determine profit is the NCF model since this model incorporates the time value of money. Profit in the cash-flow model is also referred to as net cash flow (NCF). The NCF model has one unique feature and this unique piece is called time zero. Time zero is the day that the check is written to the contractors to perform a job.
CAPEX is placed in time zero in the NCF model. It is very important that the cash-flow model is used for economic analysis, since it incorporates the time value of money. Profit excluding investment is referred to as operating cash flow. Net cash flow from investment is made up of a number of components – some positive, some negative – so for example capital expenditure (CAPEX) costs of drilling wells, laying pipelines and building facilities along with operational expenditure (OPEX) must be counted against profits from selling oil or gas.
The Oil and Gas term “Net Present Value” is the difference between the present value of cash inflows and the present value of cash outflows over a period of time. Net Present Value is used in capital budgeting and investment planning to analyze the profitability of a projected investment or project.
Net Present Value, as the name indicates, calculates the net amount that the discounted cash flows of an investment exceed the initial investment. Using the discounted cash flow (DCF) formula, the future cash flows are discounted by the rate of return offered by comparable investment alternatives (i.e. the opportunity cost of capital) and then summed and added to the initial investment amount. Net Present Value is one way of analyzing the profitability of an investment. NPV is basically the value of specific stream of future cash flows presented in today’s dollar. NPV is an essential calculation in petroleum economics due to considering time value of money and inflation.
Companies are keen to know what an actual project is worth in today’s dollar rather than, say, the dollar of 10 years from now. As a simple example, Oil and Gas operating companies project the future production rates for each well using various techniques such as decline curve, type curve, reservoir simulation, rate transient analysis, material balance, and so forth. Those future production rates that will yield future cash flows must be discounted (using cost of capital) to present value. It really does not make any logical sense for a company to announce that their profit cash flows for doing a project would be $10 million, $8 million, $12 million, and $11 million in subsequently 2, 3, 4, and 5 years.
The term “Oil Price”, refers to the spot price of one barrel of the benchmark crude oil. The price depends upon its grade, location and the content of sulfur present in it. The price of oil can be determined with the help of balance between its demand and supply. Oil storage trade is a strategy in which oil is purchased by the large oil companies when the prices are low for instant storage and delivery. Large oil companies then keep the oil stored till the prices rise.
Oil Prices play an important role in the global economy. As oil is a global commodity with high demand, there is always a possibility that the large fluctuations in the prices may have a powerful impact on the global economy. The major factors which have direct impact on the Oil Prices are market sentiment, demand and supply. When the supply decreases the demand increases and the price of oil goes up and vise versa. Oil supply depends on tax, legal framework, geological discovery, political situation of the oil producing companies and the cost of extracting the oil. The oil demand depends on the macroeconomic conditions of the globe.
The term Oil and Gas “Operational Expenditure,”consists of those expenses that a business incurs to run smoothly every single day. They are the costs that a business incurs while in the process of turning its inventory into an end product. Hence, depreciation of fixed assets that are used in the production process is considered Operational Expenditure. OPEX is also known as an operating expenditure, revenue expenditure or an operating expense.
The Oil and Gas sector plays an important role in the economy by drilling, extracting, and processing Oil and Gas. Because operating expenses vary widely with the size of Oil and Gas companies, average operating expenses tend to be meaningless. Financial professionals typically assess the average operating expenses by looking at the average operating expenses margin, which is expressed as the percentage of operating expenses in the sector's total revenues. In July 2015, the average operating expenses margin for the oil and gas industry was approximately 33%. Given the average revenue of $60 billion over the last four quarters, the average operating expense in the Oil and Gas sector stands at approximately $19.5 billion per company.
The operating expenses margin differs widely in the Oil and Gas sector. Oil and Gas drilling companies have the highest margin among all companies, at 85% of their total revenues, resulting in a negative operating income margin of 24%. Oil and gas refining and marketing companies boast the lowest operating expenses margin of 12.4%. The largest determinant of the size of the operating expenses margin is depreciation expense and the ability of Oil and Gas companies to manage their fixed costs.
The term Oil and Gas “Royalty,” refer to funds received from the production of oil or gas, free of costs, except taxes. Oil and Gas royalties are also the cash value paid by a lessee to a lessor or to one who has acquired possession of royalty rights, based on a percentage of gross production from the property, free and clear of all costs. The word "royalty," as used in connection with Oil and Gas leases, conveyances, and reservations, has a definite meaning in its popular sense. It means a share of the products, or proceeds therefrom, reserved to the owner of land for permitting another to use the property.
Whenever oil or gas production begins, the landowner is entitled to part of the total production. A royalty is agreed upon as a percentage of the lease, minus what was reasonably used in the Lessee's production costs. The royalty is paid by the Lessee to the owner of the mineral rights, the Lessor in the Lease. It is based on a percentage of the gross production from the property and is free and clear of all costs, except for taxes.
Oil Royalties may be paid in oil. The Lessor may receive oil from the Lessee and then market the oil. Unless the Lessor is wise and understands the market, electing to receive the royalty in this manner, could be a disadvantage and the landowner, electing for this arrangement, may not benefit from it. Most landowners choose to receive the royalty in cash at the posted price of the oil. A Lessor deciding to receive the oil as the royalty payment can market the oil royalty back to the Lessee for marketing and receive cash through that arrangement.
A “Tax” is a compulsory financial charge or some other type of levy imposed upon a taxpayer (an individual or other legal entity) by a governmental organization in order to fund various public expenditures. A failure to pay, along with evasion of or resistance to taxation, is punishable by law. Taxes consist of direct or indirect taxes and may be paid in money or as its labour equivalent.
An Oil and Gas company is taxed the value of produced Oil and Gas. These taxes are applied at the point of production, before accounting for transportation and distribution costs. Value taxes can be difficult to implement because states must closely monitor gas and oil sales to determine the current market value. Furthermore, because prices are prone to fluctuation, value taxes can make state revenue predictions difficult. Texas and Wyoming tax the assessed oil and gas value with reduced rates and exemptions to incentivize production from certain well types.
Under a concession, an Oil and Gas company is granted exclusive rights to exploration and production of the concession area and owns all Oil and Gas production. Under concession an Oil and Gas company typically pays royalties and corporate income tax. Other payments to the government may be applicable, such as bonuses, rentals, resource taxes, special petroleum or windfall profit taxes, export duties, state participation and others.
Definition: The term Oil and Gas “Revenue”, typically refers to a company's revenue net of discounts and returns. Sometimes, though, the user is referring to net profit, which is sales net of all expenses. Generation of revenue is an important driver that influences the Oil and Gas industry. Operating cost of a refinery is very huge and in many instances, this will affect adversely on offshore operations.
Although the revenue generated is high, industry need to adapt itself to the global market. With the ever-increasing demand and dependence on these energy sources, it is hoped that this industry will continue to create revenue to invest in new exploration projects and technology, and the costs would gradually stabilise.
Exploration & Production companies report their Oil and Gas reserves the quantity of Oil and Gas they own that is still in the ground in the same bbl and mcf terms. Reserves are often used to value Exploration & Production companies and make predictions for their revenue and earnings. New reserves, of course, are the primary source of future revenue, so Exploration & Production companies spend a lot of time and money exploring for new petroleum reserves. If an Exploration & Production company stops exploring, it will generate revenue from a finite and depleting quantity of petroleum and revenue inevitably will decline over time.
Definition: The term Oil and Gas “Capital Expenditure, or CAPEX ”, is financing used by companies to secure physical assets or upgrade current assets. CAPEX generally takes two forms; maintenance expenditure, in which a company purchases assets that extend the useful life of existing assets, and expansion expenditure, in which a company purchases new assets in an effort to grow the business.
CAPEX is basically capital expenditures such as drilling & completing a well. It’s a critical component to capital budgeting & should be monitored well. Capital Expenditures incurred in exploration activities should be expensed unless they meet the definition of an asset. An entity recognizes an asset when it is probable that economic benefits will flow to the entity as a result of the expenditure. The economic benefits might be available through commercial exploitation of hydrocarbon reserves or sales of exploration findings or further development rights. It is difficult for an entity to demonstrate that the recovery of exploration expenditure is probable. Where entities do not adopt IFRS 6 and instead develop a policy under the Framework, expenditures on an exploration property are expensed until the capitalization point.
Definition: The term Oil and Gas “Operational Expenditure”, consists of those expenses that a business incurs to run smoothly every single day. They are the costs that a business incurs while in the process of turning its inventory into an end product. Hence, depreciation of fixed assets that are used in the production process is considered Operational expenditure. OPEX is also known as an operating expenditure, revenue expenditure or an operating expense.
The Oil and Gas sector plays an important role in the economy by drilling, extracting, and processing Oil and Gas. Because operating expenses vary widely with the size of Oil and Gas companies, average operating expenses tend to be meaningless. Financial professionals typically assess the average operating expenses by looking at the average operating expenses margin, which is expressed as the percentage of operating expenses in the sector's total revenues. In July 2015, the average operating expenses margin for the Oil and Gas industry was approximately 33%. Given the average revenue of $60 billion over the last four quarters, the average operating expense in the Oil and Gas sector stands at approximately $19.5 billion per company.
The operating expenses margin differs widely in the Oil and Gas sector. Oil and Gas drilling companies have the highest margin among all companies, at 85% of their total revenues, resulting in a negative operating income margin of 24%. Oil and Gas refining and marketing companies boast the lowest operating expenses margin of 12.4%. The largest determinant of the size of the operating expenses margin is depreciation expense and the ability of Oil and Gas companies to manage their fixed costs
Definition: The term “Oil Price”, refers to the spot price of one barrel of the benchmark crude oil. The price depends upon its grade, location and the content of sulfur present in it. The price of oil can be determined with the help of balance between its demand and supply. Oil storage trade is a strategy in which oil is purchased by the large oil companies when the prices are low for instant storage and delivery. Large oil companies then keep the oil stored till the prices rise.
Oil Prices play an important role in the global economy. As oil is a global commodity with high demand, there is always a possibility that the large fluctuations in the prices may have a powerful impact on the global economy. The major factors which have direct impact on the Oil Prices are market sentiment, demand and supply. When the supply decreases the demand increases and the price of oil goes up and vise versa. Oil supply depends on tax, legal framework, geological discovery, political situation of the oil producing companies and the cost of extracting the oil. The oil demand depends on the macroeconomic conditions of the globe.
Definition: The term “Cost of Capital” refers to the weighted average cost of various capital components, i.e. sources of finance, employed by the firm such as equity, preference or debt. In finer terms, it is the rate of return, that must be received by the firm on its investment projects, to attract investors for investing capital in the firm and to maintain its market value.
The Cost of capital (WACC), as the name implies, is the firm’s overall capital structure, i.e. its cost of equity (re) and its cost of debt (rd). The Cost of Capital is just an algebraic manipulation to combine the re and rd into their respective proportion reflecting the capital structure of the investor. Cost of Capital represents the expected return on a portfolio of all the company’s securities, i.e. equity and debt. This rate is applied to project cash flows - cash flows excluding the cash outflows due to financing (i.e. interest payment, principal payment, or the tax benefit created due to the tax deductible interest payments). The side effects of the project financing are instead bundled in the WACC
Definition: The term Oil and Gas “Net Cash Flow ”, is the difference between a company's cash inflows and outflows in a given period. In the strictest sense, net cash flow refers to the change in a company's cash balance as detailed on its cash flow statement. One can approximate a company's net cash flow by looking at the period-over-period change in cash on the balance sheet. However, the statement of cash flows is a more insightful place to look. Net cash flow is the sum of cash flow from operations (CFO), cash flow from investing (CFI), and cash flow from financing (CFF).
Net Cash Flow is most commonly used model in the Oil and Gas industry to determine profit is the NCF model since this model incorporates the time value of money. Profit in the cash-flow model is also referred to as net cash flow (NCF). The NCF model has one unique feature and this unique piece is called time zero. Time zero is the day that the check is written to the contractors to perform a job.
CAPEX is placed in time zero in the NCF model. It is very important that the cash-flow model is used for economic analysis, since it incorporates the time value of money. Profit excluding investment is referred to as operating cash flow. Net cash flow from investment is made up of a number of components – some positive, some negative – so for example capital expenditure (CAPEX) costs of drilling wells, laying pipelines and building facilities along with operational expenditure (OPEX) must be counted against profits from selling oil or gas.
Definition: The Oil and Gas term “Net Present Value ”, is the difference between the present value of cash inflows and the present value of cash outflows over a period of time. Net Present Value is used in capital budgeting and investment planning to analyze the profitability of a projected investment or project.
Net Present Value as the name indicates calculates the net amount that the discounted cash flows of an investment exceed the initial investment. Using the discounted cash flow (DCF) formula, the future cash flows are discounted by the rate of return offered by comparable investment alternatives (i.e. the opportunity cost of capital) and then summed and added to the initial investment amount. Net Present Value is one way of analyzing the profitability of an investment. NPV is basically the value of specific stream of future cash flows presented in today’s dollar. NPV is an essential calculation in petroleum economics due to considering time value of money and inflation.
Companies are keen to know what an actual project is worth in today’s dollar rather than, say, the dollar of 10 years from now. As a simple example, Oil and Gas operating companies project the future production rates for each well using various techniques such as decline curve, type curve, reservoir simulation, rate transient analysis, material balance, and so forth. Those future production rates that will yield future cash flows must be discounted (using cost of capital) to present value. It really does not make any logical sense for a company to announce that their profit cash flows for doing a project would be $10 million, $8 million, $12 million, and $11 million in subsequently 2, 3, 4, and 5 years.
Definition: The term “Planned Volume” is defined as a plan that an Oil and Gas company lays out, typically broken down into a step-by-step format, for utilizing its available capital and other assets to meet its goals for increased production volume based on a reasonable financial forecast. A financial plan can be considered synonymous with a business plan in that it lays out what a company plans to do in terms of putting resources to work to generate maximum possible revenues.
Definition: The term “Forecasted Volume” is defined as is an estimation or projection of likely future Oil production volume. Financial forecasts are commonly reviewed and revised annually as new information regarding assets and costs becomes available. The new data enables an individual or business to make more accurate financial projections. It is easier for established companies that generate steady revenues to make accurate financial forecasts than it is for new businesses or companies whose revenue is subject to significant seasonal or cyclical fluctuations.
Definition: “Planned costs” can be defined as the costs required to plan a well properly that are insignificant in comparison to the actual drilling costs. In many cases, less than $1,000 is spent in planning a $1 million well. This represents 1/10 of 1%; of the well costs.
Unfortunately, many historical instances can be used to demonstrate that well planning costs were sacrificed or avoided in an effort to be cost conscious. The end result often is a final well cost that exceeds the amount required to drill the well, if proper planning had been exercised. Perhaps the most common attempted shortcut is to minimize data-collection work. Although good data can normally be obtained for small sums, many well plans are generated without the knowledge of possible drilling problems. This lack of expenditure in the early stages of the planning process generally results in higher-than-anticipated drilling costs.
Definition: The term “Forecasted Cost” is defined as is an estimation or projection of likely plan a well properly that are insignificant in comparison to the actual drilling costs. Financial forecasts are commonly reviewed and revised annually as new information regarding assets and costs becomes available. The new data enables an individual or business to make more accurate financial projections. It is easier for established companies that generate steady revenues to make accurate financial forecasts than it is for new businesses or companies whose revenue is subject to significant seasonal or cyclical fluctuations.
Definition: “Proven Reserves” is the quantity of natural resources that a company reasonably expects to extract from a given formation. Proven reserves are established using geological and engineering data gathered through seismic testing and exploratory drilling. In Oil and Gas extraction, once the physical shape of a formation is understood, the reservoir is estimated by fluid contacts. Fluid contacts refer to the natural layering of gas, oil and water in a formation. An accurate picture of the formation shape and known levels of fluid contact provide the data for a volume estimate with a high degree of confidence.
Proven reserves are classified as having a 90% or greater likelihood of being present and economically viable for extraction in current conditions. Proven reserves are also referred to as proved reserves. Within the oil industry, proven reserves are also referred to as P1 or P90. Proven reserves also take into account the current technology being used for extraction, regional regulations and market conditions as part of the estimation process. For this reason, proven reserves can seemingly take unexpected leaps and drops. Depending on the regional disclosure regulations, extraction companies might only disclose proven reserves even though they will have estimates for probable and possible reserves.
Understanding the natural resource extraction industry can be challenging because proven reserves are just one of three classifications. Most people assume proven Oil and Gas reserves should only go up when new exploratory wells are drilled, resulting in new reservoirs being discovered. In reality, there is often more significant gains and losses resulting from shifts between classifications than there are increases in proven reserves from truly new discoveries.
Definition: “Unproven Reserves” are based on geologic and/or engineering data similar to that used in estimates of proved reserves; but technical, contractual, economic, or regulatory uncertainties preclude such reserves being classified as proved. Unproved reserves may be further classified as probable reserves and possible reserves. Unproved reserves may be estimated assuming future economic conditions different from those prevailing at the time of the estimate. The effect of possible future improvements in economic conditions and technological developments can be expressed by allocating appropriate quantities of reserves to the probable and possible classifications.
Unproven reserves, due to regulatory or economic factors, are estimated as less recoverable and therefore unproven. This class of reserves is further broken down into subcategories of probable and possible. The SEC requires the lower certainty evaluations to be verified by a third party before an Oil and Gas company can publicly state them to potential investors.
Unproven Reserve is a geologically equivalent to proven reserves, their unproven status rests on technical, regulatory, or political issues. Unproven reserves fall into two categories: probable and possible. A probable reserve has a 50% chance for petroleum recovery and is termed in the industry P50. A possible reserve, also called a P10 reserve, has a 10% chance of recovery.
Definition: The term “Exploration Costs” is defined as the costs an oil or gas company incurs while searching for oil or gas to drill. Exploration costs include the cost of researching appropriate places to drill and the cost of actually drilling. There is no guarantee that there will be a return on the investment of exploration costs because there is no guarantee that the company will find oil or natural gas. Exploration costs can also be quite expensive.
Exploration Costs (including prospecting) related to Oil and Gas producing entities and would be included in operating expenses of that entity. Costs incurred in identifying areas that may warrant examination and in examining specific areas that are considered to have prospects of containing Oil and Gas reserves, including costs of drilling exploratory wells and exploratory-type stratigraphic test wells. Exploration costs may be incurred both before acquiring the related property (sometimes referred to in part as prospecting costs) and after acquiring the property. Principal types of exploration costs, which include depreciation and applicable operating costs of support equipment and facilities and other costs of exploration activities.
Exploration costs are incurred to discover hydrocarbon resources. Evaluation costs are incurred to assess the technical feasibility and commercial viability of the resources found. Exploration, as defined in IFRS 6 Exploration and evaluation of mineral resources, starts when the legal rights to explore have been obtained. Expenditure incurred before obtaining the legal right to explore is generally expensed; an exception to this would be separately acquired intangible assets such as payment for an option to obtain legal rights.
Definition: “Development Costs” are costs incurred to obtain access to proved reserves and to provide facilities for extracting, treating, gathering and storing the Oil and Gas. An entity should develop an accounting policy for development expenditure based on the guidance in IAS 16, IAS 38 and the Framework. Much development Costs results in assets that meet the recognition criteria in IFRS. 22 Development Costs are capitalised to the extent that they are necessary to bring the property to commercial production.
Entities should also consider the extent to which abnormal costs have been incurred in developing the asset. IAS 16 requires that the cost of abnormal amounts of labor or other resources involved in constructing an asset should not be included in the cost of that asset. Entities will sometimes encounter difficulties in their drilling plans and make adjustments to these, with the side track issue discussed in section 2.3.8 being one example. There will be a cost associated with this, and entities should develop a policy on how such costs are assessed as being normal or abnormal.
Costs incurred after the point at which commercial production has commenced should only be capitalized if the expenditures meet the asset recognition criteria in IAS 16 or 38.
Definition: “Production Costs” (also called Lifting Costs) are the costs to operate and maintain wells and related equipment and facilities per barrel of oil equivalent (BOE) of Oil and Gas produced by those facilities after the hydrocarbons have been found, acquired, and developed for production. Direct lifting costs are total production spending minus production taxes (and also minus royalties in foreign regions) divided by oil and natural gas production in BOE. Total lifting costs are the sum of direct lifting costs and production taxes.
Productions Costs are also defined as the costs associated with the operation of Oil and Gas wells to bring hydrocarbons to the surface after wells (facilities necessary for the production of oil) have been drilled. This figure includes labor costs, electricity costs and maintenance costs. Non-income related taxes: as production of hydrocarbons is such a lucrative business, governments also want to have their shares. There exists an abundance of different model how the state can profit from hydrocarbon production (profit sharing, royalties, etc.).
Production Operations is responsible to manage and optimize Production costs. Productions costs are also often called Lease Operating Expense (LOE). It is the job of analysts to allocate production costs between Oil and Gas using relative production weightings, with oil today generally receiving a greater share of the cost.
Definition: The term “Enhanced Recovery” is defined as the amount an Oil and Gas company invests on Enhanced oil recovery processes. Enhanced oil recovery (EOR) is the technique or process where the physicochemical (physical and chemical) properties of the rock are changed to enhance the recovery of hydrocarbon. The properties of the reservoir fluid system which are affected by EOR process are chemical, biochemical, density, miscibility, interfacial tension (IFT)/surface tension (ST), viscosity and thermal. EOR often is called tertiary recovery if it is performed after waterflooding.
Sophisticated equipment and complex technologies are required to recover natural gas from underground reservoirs. But depending on the geology of these areas, this fuel can never be completely removed. The natural pressure in gas pockets usually limits yield to around 75 percent and a maximum of 50 percent in the case of oil. But there are methods with which natural gas can still be extracted, even after recovery is quite far along. One useful tool is nitrogen (N2).According to studies by independent research institutes, nitrogen (N2) or carbon dioxide (CO2) can be used to increase the pressure in Oil and Gas fields and thus improve the output. This reduces delays or drops in the recovery rate.
Definition: The term “Improved Recovery” is defined as the amount an Oil and Gas company invests on Improved recovery processes. Improved Recovery is a method used to recover the additional oil left after rock compressibility, fluid expansion, pressure decline, natural gas drive or water drive and gravitational drainage. The process involves the implementation of several artificial techniques to increase the amount of fluids which can be extracted from oilfields.
There are three dominant techniques that are used for Improved Recovery, i.e., gas injection, chemical injection and thermal injection. It also includes gas cycling, pressure maintenance, enhanced recovery and secondary recovery. Improved Recovery is also known as improved oil recovery, enhanced oil recovery and tertiary recovery. It is a process like gas flooding or waterflooding which adds energy to reservoirs for increasing the recovery factor and stimulating the oil production.
Definition: The term “Proved Reserve Acquisition Costs” are the costs incurred by an Oil and Gas company on Acquiring Proved Reserves. Proved Reserves is the quantity of natural resources that a company reasonably expects to extract from a given formation. Proven reserves are established using geological and engineering data gathered through seismic testing and exploratory drilling. In Oil and Gas extraction, once the physical shape of a formation is understood, the reservoir is estimated by fluid contacts. Fluid contacts refer to the natural layering of gas, oil and water in a formation. An accurate picture of the formation shape and known levels of fluid contact provide the data for a volume estimate with a high degree of confidence.
Proven reserves are classified as having a 90% or greater likelihood of being present and economically viable for extraction in current conditions. Proven reserves are also referred to as proved reserves. Within the oil industry, proven reserves are also referred to as P1 or P90. Proven reserves also take into account the current technology being used for extraction, regional regulations and market conditions as part of the estimation process. For this reason, proven reserves can seemingly take unexpected leaps and drops. Depending on the regional disclosure regulations, extraction companies might only disclose proven reserves even though they will have estimates for probable and possible reserves.
Definition: The term “Finding and Development (F&D)” refers to costs incurred when a company purchases, researches and develops properties in an effort to establish commodity reserves. Exploration and development businesses rely on finding commodities to manufacture and sell. Finding and development costs represent a cost of doing business for these types of companies. The costs are calculated by dividing the costs incurred during a period of time by the number of commodities found during that same time. Oil is usually measured in barrels; gas is often measured by a given quantity of cubic feet.
While the term finding and development can relate to costs incurred by any type of commodity company, it is commonly used in regards to the upstream costs of an oil or gas business. In this case, the costs of finding and development can be expressed per barrel. Finding costs are calculated over a given period of time. During that period, the amount of money spent to locate additional commodity reserves is tallied then divided by the additional quantity of reserves actually discovered during that same time period.
Finding and Development Cost is an important performance measure that is used to evaluate Oil and Gas operations of oil companies, and it considered a tool to measure the company’s performance. This also gives a yardstick to measure a company’s ability to establish a long-term trend of adding reserves and resources at a reasonable cost.
Definition: The term “Reserve Replacement Costs” refers to cost incurred by an upstream company by considering a per-barrel-of-oil equivalent of the new reserve. Reserve Replacement Cost has a direct bearing on the future profitability of any upstream company. If a company’s Reserve Replacement Cost is too high compared to peers, it’s generally not good for the future margins or future profitability of the company.
Reserve replacement cost (RRC) is calculated by dividing development, exploitation, exploration and acquisition capital expenditures, reduced by proceeds of divestitures, for the period by net estimated proved reserve additions for the period from all sources, including acquisitions and divestitures. Our calculation of reserve replacement cost includes costs and reserve additions related to the purchase of proved reserves. The methods we use to calculate our reserve replacement cost may differ significantly from methods used by other companies to compute similar measures. As a result, our reserve replacement cost may not be comparable to similar measures provided by other companies. We believe that providing a measure of reserve replacement cost is useful in evaluating the cost, on a per-Mcfe basis, to add proved reserves.
However, this measure is provided in addition to, and not as an alternative for, and should be read in conjunction with, the information contained in our financial statements prepared in accordance with generally accepted accounting principles. Due to various factors, including timing differences in the addition of proved reserves and the related costs to develop those reserves, reserve replacement costs do not necessarily reflect precisely the costs associated with particular reserves.
Definition: The term “Recovery Factor” is a function of the displacement mechanism. An important objective of enhanced oil recovery is to increase the recovery factor. The recoverable amount of hydrocarbon initially in place, normally expressed as a percentage.
The lifecycle of an oilfield is typically characterized by three main stages: production buildup, plateau production, and declining production. Sustaining the required production levels over the duration of the lifecycle requires a good understanding of and the ability to control the recovery mechanisms involved. Increasing the recovery factor of maturing waterflooding projects by 10 to 30% could contribute significantly to the much-needed energy supply. To accomplish this, operators and service companies need to find ways to maximize recovery while minimizing operational costs and environmental imprint.
For primary recovery (i.e., natural depletion of reservoir pressure), the lifecycle is generally short and the recovery factor does not exceed 20% in most cases. For secondary recovery, relying on either natural or artificial water or gas injection, the incremental recovery ranges from 15 to 25%. Globally, the overall recovery factors for combined primary and secondary recovery range between 35 and 45%. Increasing the recovery factor of maturing waterflooding projects by 10 to 30% could contribute significantly to the much-needed energy supply. To accomplish this, operators and service companies need to find ways to maximize recovery while minimizing operational costs and environmental imprint.
Definition: The term “Estimated Ultimate Recovery (EUR)” is defined as an approximation of the quantity of oil or gas that is potentially recoverable or has already been recovered from a reserve or well. Estimated ultimate recovery can be calculated using many differing methods and units depending on the project or study being conducted. In the Oil and Gas industry, it is of the utmost importance that drilling projects meet an acceptable EUR threshold for a project to be considered viable and profitable.
Part of an oil field's probable and possible reserves are converted into proven reserves over time. These reserves can be recategorized for a number of reasons ranging from improvements in oil recovery methods and techniques to changing oil prices. For example, as oil prices rise, the quantity of proven reserves also rises because the breakeven price of recovery can be met. Reserves that were too expensive to produce at lower oil prices become viable as oil prices rise. This makes it possible to reclassify these more costly reserves as proven. The opposite happens as oil prices fall. If oil reserves become too expensive to recover at current market prices, the probability of them being produced also falls. This results in reserves being reclassified from proven back to probable or even possible.
Without an estimated ultimate recovery, oil companies would not be able to make rational investment decisions. Like all projects, management needs to be able to estimate accurately the net present value (NPV) of an oil drilling project. This valuation exercise requires several inputs, like the cost of bringing the first barrel to production, the cost of capital, the long-term price of oil and the ultimate amount of oil that will be produced, or EUR. Without an EUR, it would not be possible to reach an accurate valuation of the potential oil reserves.
Definition: The term “Lost Time Injury Frequency” is defined as the number of lost time injuries occurring in a workplace per 1 million hours worked. An Lost Time Injury Frequency of 7, for example, shows that 7 lost time injuries occur on a jobsite every 1 million hours worked. The formula gives a picture of how safe a workplace is for its workers. Lost time injuries (LTI) include all on-the-job injuries that require a person to stay away from work more than 24 hours, or which result in death or permanent disability.
Lost Time Injury Frequency is a crude indicator of safety performance and it should be considered alongside other metrics. As businesses work to reduce incidents and injuries among their employees, it’s natural to look for some way to quantify that progress. While it may be subject to some controversy, the lost time injury frequency rate (LTIFR) is one way to do it. An organization’s lost time injury frequency rate is a proxy measurement of its safety performance. It represents the number of lost time injuries that have occurred within a given accounting period, relative to the total number of hours worked in that period. It’s a lagging indicator of safety performance that can help businesses benchmark the HSE performance of their industry.
Since the Lost Time Injury Frequency number is always quite small, it’s standard practice to multiply it by 200,000 (though note that some companies and industries use a base rate of 1,000,000 instead). Companies, then, report the figure as the number of lost time injuries per million hours worked.
Definition: The term “Recordable Injury Rate” is defined as the number of fatalities, lost time injuries, substitute work, and other injuries requiring treatment by a medical professional per million hours worked. A company's recordable injury frequency rate is one of many metrics that companies can use to assess their safety performance and may be required to compile it by OSH regulations. Recordable Injury Rate is a lagging indicator of safety, meaning it represents the company's past safety performance but does not give us solid grounds to predict its future incident rate.
The Recordable Injury Rate is not to be confused with the similarly named lost time injury frequency rate. This latter metric is limited to the number of fatalities and lost time injuries per million employees and does not include other types of injuries. Recordable Incident Rate (or Incident Rate) is calculated by multiplying the number of recordable cases by 200,000, and then dividing that number by the number of labor hours at the company.
Smaller companies that experience recordable incidents will most likely have high incident rates, or the incident rates will fluctuate significantly from year to year. This is because of the small number of employees (and hence the lower number of labor hours worked) at the company. Calculations are more meaningful at larger companies that have a higher labor hour count.
Definition: The term “Fatalities” is defined as the number of death of human caused by an accident, or is the quality of the disaster being able to cause the death of a human(s). Fatality in the context of occupational health and safety is a death caused by an accident at the workplace, on the way to and from the workplace, or during other works or movements directly or indirectly related to the occupation.
Drilling is an inherently dangerous undertaking, with a fatality rate nearly five times that of all industries. The number of workers exposed to death, injury and illness in the upstream portion of the Oil and Gas industry exploration and production is growing.
Definition: The term “Fatal Accident Rates” is defined as a measure of individual risk expressed as the estimated number of fatalities per 108 exposure hours (roughly 1000 employee working lifetimes). Fatal Accidents are an increasingly rare occurrence when it comes to oil rigs. On an oil rig there are many components at work, and you’re essentially channelling flammable materials all around you.
Each time a disaster happens, engineers learn something new about how to prevent disasters and make the oil rig as a whole a safer environment to work in. The Oil and Gas Well Drilling Industries can quickly become one of the most dangerous enterprises of all if safety is bypassed. Out of the documented injuries that have occurred in this sector, there was reportedly a twenty-seven percent fatality rate increase seen from 2013 to 2014, with 142 fatal injuries, making the rate nearly 16 deaths per 100,000 workers. These increases almost make it the highest fatality rate of all job sectors.
Definition: The term “Occupational Illness” is defined as a illness that is a chronic ailment caused by exposure typically over a prolonged period to workplace hazards or work activities. It’s hard to prevent occupational illnesses because work is often difficult to spot and regulate. An illness usually develops over time, and as a result, the connection between cause and effect is not immediately obvious. By the time you notice it, the illness may require extensive treatment or could be permanent.
Health and safety has been prioritized in oil and gas industry for many years. Still, occupational hygiene exposures are often taken with proper care to determine the true risk to workers. Oil and gas workers exposed to chemicals produced and used in Oil and Gas industry may suffer occupational diseases of lungs, skin and other organs at levels relying on the amount and length of exposure time. Those exposed to hazardous noise levels may suffer noise-induced hearing loss (NIHL). Other hazards include confined spaces that may injury or threaten life of untrainedworkers.
Definition: The term “Economic Cost due to Illness” is defined as Estimating total costs incurred because of a disease or condition. Cost-of-illness analysis typically includes the value of medical care resources used to treat a disease and the losses in productivity to society because of the illness. Non-medical costs associated with the illness are sometimes included as well.
Decreased or lost productivity can be the result of illness, premature death, side effects of illness or treatment, or time spending receiving treatment. This not only affects the employee but also the family members, who reduce or stop their employment to take care of the employee. With premature death, the indirect cost is the loss in potential wage and benefits.
Cost analysis gives an indication of the financial impact of disease, and provides information to policy makers, researchers, and medical specialists that can be considered in making more efficient use of resources. Additionally, on the basis of distinction between different cost components, it may be possible to estimate the financial aspect of various treatment strategies, which can influence the choice of treatment.
Definition: The term “Oil Spill Costs” is defined as costs incurred to prevent oil spills. An oil spill of heavy fuel oil, which could devastate fragile world and destroy food sources for arctic communities, is the top threat associated with increased Arctic shipping. Heavy fuel oil is extremely toxic and slow to degrade. Oil spill response in the remote Arctic is virtually non-existent.
Definition: The term “Gas Emission” is defined as the emission into the earth's atmosphere of any of various gases, especially carbon dioxide, that contribute to the greenhouse effect. Greenhouse gases include carbon dioxide (CO2), methane (CH4) and nitrous oxide (N2O), occurring naturally and as the result of human activity.
Indirect greenhouse gas (GHG) emissions from Oil and Gas operations, including both carbon dioxide and methane emissions, today are around 5 200 million tones (Mt) of carbon-dioxide equivalent. These emissions which do not include any emissions associated with the actual consumption of the fuel amount to around 15% of the energy sector’s total GHG emissions. For gas, indirect emissions sources are between 15% and 40% of its full lifecycle emissions intensity. This means that around 97% of gas consumed today has a lower lifecycle emissions intensity than coal. Nevertheless, the aim for the future should be to focus on cost-effective ways to minimize the gap between gas and zero-carbon technologies rather than focus on the gap between coal and gas.
Definition: Oil company “Assets” are classified in three main divisions: upstream, midstream and downstream. Upstream operations are the exploration for Oil and Gas and the appraisal, development and production of any discovery, and most oil companies do not own equipment for upstream activities; they hire contractors to perform services such as geophysical surveys, well drilling and geological and environmental studies. Midstream assets are linked to the initial processing, storage and transportation of oil and gas. Crude oil refining into products such as gasoline, kerosene and diesel is a downstream activity, as is the product distribution to and marketing by a retail network.
Definition: The term “Asset Value” represents the net value of an entity and is calculated as the total value of the entity’s assets minus the total value of its liabilities. In the context of companies and business entities, the difference between the assets and the liabilities is known as the net assets or the net worth or the capital of the company.
In restructurings involving Oil and Gas reserves, the asset valuation analyses are often more complex because of the technical data and skillset required to value these reserves. Although valuing Oil and Gas assets is not necessarily more difficult than valuing other asset classes, valuing these types of assets requires a detailed understanding of the relative merits of traditional valuation methods.
Valuing Oil and Gas assets, which comprise a depleting asset base where value is correlated to constantly changing commodity prices and historical production trends, demands a thorough understanding of the technical details included in a company’s reserve database. Although commodity prices fluctuate, the value estimates of the underlying Oil and Gas assets should be based on current conditions, and are not intended to reflect unforeseeable economic or environmental events that could alter the fair market value subsequent to the valuation date.
Definition: The term “Proven reserves” is the quantity of natural resources that a company reasonably expects to extract from a given formation. Proven reserves are established using geological and engineering data gathered through seismic testing and exploratory drilling. In Oil and Gas extraction, once the physical shape of a formation is understood, the reservoir is estimated by fluid contacts. Fluid contacts refer to the natural layering of gas, oil and water in a formation. An accurate picture of the formation shape and known levels of fluid contact provide the data for a volume estimate with a high degree of confidence. Proven reserves are classified as having a 90% or greater likelihood of being present and economically viable for extraction in current conditions. Proven reserves are also referred to as proved reserves.
Proven reserves also take into account the current technology being used for extraction, regional regulations and market conditions as part of the estimation process. For this reason, proven reserves can seemingly take unexpected leaps and drops. Depending on the regional disclosure regulations, extraction companies might only disclose proven reserves even though they will have estimates for probable and possible reserves.
Definition: The term “Oil Lease” is essentially an agreement between parties to allow a Lessee (the Oil and Gas company and their production crew) to have access to the property and minerals (Oil and Gas) on the property of the Lessor. The lease agreement is a legal contract of terms. It contains certain elements, which confirm all the terms of the agreement. The lease must be dated and the lease also sets the time that the lease is effective. It establishes the primary term of the lease.
Of great importance to the landowner, the Lessor, is the royalty clause. This clause states the percentage or share of production proceeds that the Lessor receives and how the royalty is received. The Lessee is given rights in the drilling and delay rental clause. This allows the Lessee to defer immediate use of the property if the Lessee completes the obligation within a period of time and pays delay rental.
Definition: There are numerous terms and conditions listed in an Oil and Gas lease. One is “Pooling”, and it is contained in most leases. In most states, landowners may be subjected to two types of pooling arrangements. One is voluntary and the other is compulsory or statutory. In order for pooling to occur, the mineral rights’ owner must consent. By consenting to a pooling arrangement, the landowner must be careful because the utilization of pooling can materially alter the lease provisions. For example, potential royalties can be significantly reduced because the pooling provisions reduce the number of wells necessary to keep the lease in effect.
Pooling is the combination of all or portions of multiple oil and gas leases to form a unit for the drilling of a single oil and/or gas well. The unit is generally one or a combination of government survey quarter-quarter sections. Generally the interest owners in the pooled unit share the revenue from the well on the basis of surface acreage or mineral acreage owned by each interest owner in the pooled unit.
Pooling can impact the lease provisions, which may provide some unpleasant surprises as to the extent it can impact the lease. (We will discuss these in part 2 of this series.) Here are some things landowners might want to keep in mind when granting the rights to pool the leased premises. These can prevent unexpected and negative consequences from granting the right to pool.
Definition: A “Mineral Deed” is a legal document which contains the details about the transfer of any mineral rights, royalty interests and overriding royalty interest owned by any royalty interest owner to Oil and Gas mineral acquisition organizations or any drilling organization with a warranty of title or without a warranty of title. If the title is not warranted in a legal document, then this mineral deed is considered as a quitclaim deed.
In the Oil and Gas industry, the entity who owns the mineral rights is called the grantor and when the grantor transfers royalty interests to another entity, the other entity is called the grantee. In simple terms an owner of the property or a grantor can own surface area of the property as well as minerals down below the property. Both the surface area of a property and the minerals below this surface area are treated as two separate legal interests. If these rights need to be transferred to any other entity, such as Oil and Gas operating organizations or minerals and royalty acquisition organizations, it can be done by signing the mineral deed which legally conveys the actual rights to the minerals while still remaining separate from the surface rights.
Definition: The term “Acreage” is defined as the amount of leased real estate that a petroleum and/or natural gas company has a working interest in. Gross Acreage is different from net acreage if a company shares its working interest with another company or companies. The company's true interest is expressed in net acres. Net acreage is calculated by multiplying the company's percentage interest by the gross acreage. If a company holds the entire working interest, its net acreage and gross acreage will be the same.
A company's number of gross acreage is an indication to investors of the company's size, market position and current activity. However, a company's acreage does not tell the whole story. A potential investor needs to investigate what the company is doing with that acreage. Is it drilling wells? If so, at what pace? How many barrels of oil is the area producing and how many is it expected to produce?
Larger companies will usually have an interest in hundreds of thousands of gross acres, while smaller ones may only have an interest in tens of thousands of gross acres. The largest companies will have total holdings of millions of gross acres.
Definition: The primary lease term has an ending date that applies if the land is not actually drilled or producing minerals for the lessee. If at this date nothing is being done on the land, the lease expires. This changes completely if the lessee is in the process of drilling whether producing gas and oil or not. If there is active exploration or drilling going on that began prior to the primary term's expiration date, the lease is still considered to be in effect provided the company does not stop work for longer than 90 days.
In other words, as long as a lessee engages in drilling even one day prior to the end of the contract, they are allowed to keep doing so to either produce minerals or determine a well is dry. The lessee can drill as many holes as they wish, exploring beyond the lease expiration date, provided they continue to do so with the intent to produce. This automatic extension is said to be the secondary lease term.
When leasing gas and oil rights, when the secondary lease term goes into effect there certain things can happen. The drilling company can continue exploring the land until they begin to produce Oil and Gas, regardless of how long that takes as long as efforts do not lapse for greater than 90 days. If and when they are able to produce minerals, they are also permitted to continue doing so provided they do not cease production for longer than 60 days.
Definition: An “Oil Well” is a boring in the Earth that is designed to bring petroleum oil hydrocarbons to the surface. Usually some natural gas is released along with the oil. A well that is designed to produce only gas may be termed a gas well. There are numerous different ways that oil well can be drilled to maximize the output of the well while minimizing other costs. The most common type of well drilled today is known as a conventional well. These wells are wells drilled in the traditional sense in that a location is chosen above the reservoir and the well is drilled vertically downward. Additionally, wells with a small amount of deviation in their path from the vertical are also considered to be conventional. This slight turning of the well is obtained during drilling by using a type of steerable device that shifts the direction the well is being dug. These wells are the most common and are fairly inexpensive to drill.
Horizontal wells are an alternative type of well used when conventional wells do not yield enough fuel. These wells are drilled and steered to enter a deposit nearly horizontally. These wells can hit targets and stimulate reservoirs in ways that a vertical well cannot. Combined with hydraulic fracturing previously unproductive rocks can be used as sources for natural gas. Examples of these types of deposits include formations that contain shale gas or tight gas.
Other types of wells include offshore wells, which are wells that are drilled in the water instead of onshore. These provide access to previous inaccessible oil deposits. Multilateral wells are wells used occasionally that have several branches off of the main borehole that drain a separate part of the reservoir.
Definition: The term “High Consequence Area Miles” is a buffer that usually extends 660 feet (200 meters) to either side of a segment of pipeline which passes through developed areas where people live in an urban or suburban setting, or where they frequently gather, like a school. Pipelines within an HCA are required to have extra safety features or extra precautions must be taken by pipeline operators depending on the type of pipeline, the material being conveyed, and other factors.
Although commonly assumed to run through areas with a high population density, that is not the full picture of how HCAs are designated. There is a detailed process that pipeline operators (the pipeline companies) must follow to determine where an HCA is located. Pipeline operators are required to establish and implement a higher level of safety features for pipelines within an HCA compared to pipelines outside an HCA. Thus, any property within an HCA will have greater safety protections.
A random pipeline leak or some other malfunction could possibly occur on any segment of a given pipeline, either inside or outside an HCA. However, because the land within an HCA is usually more densely populated, a leak inside an HCA could cause more harm and injuries than the very same sort of leak outside an HCA. In other words, there are more safety provisions with an HCA because more people are living or gathering there. It is not the type or condition of the pipeline which causes a HCA to be established, but rather the population density, types of land use, and features of the lands near the pipeline.
Definition: An operator is required to temporarily reduce operating pressure or shut down the pipeline until the operator could complete the repair, basing the temporary operating pressure reduction on remaining wall thickness. immediate repair conditions are those where the indicated anomaly may suggest the potential for imminent failure. However, API objected to limiting an operator's actions to address these conditions to repair of the condition. API recommended renaming these immediate concern conditions, and allowing an operator to take actions other than repair.
To maintain safety, an operator must temporarily reduce the operating pressure or shut down the pipeline until the operator completes the repair of these conditions. An operator must calculate the temporary reduction in operating pressure. If no suitable remaining strength calculation method can be identified, an operator must implement a minimum 20 percent or greater operating pressure reduction, based on actual operating pressure for two months prior to the date of inspection, until the anomaly is repaired.
Definition: Many pipeline accidents have proven that the damage from a leak that impacts a high consequence area, known as a HCA, is greatly compounded and endures far longer than leaks elsewhere. HCAs also include populated areas and sensitive ecological resources including locations where federally listed threatened and endangered species can be found, and areas where migratory water birds concentrate. Good engineering practices and pipeline regulations require pipeline operators to augment the leak detection systems on sections where a pipeline failure could affect a high consequence area.
The leak detection systems that cover the entire length of a cross-country pipeline often lack sufficient intermediate sensors and are limited in their ability to detect and locate very small leaks close to a HCA. If a secondary leak detection system is added with sensors installed immediately upstream, and downstream of the HCA section, this new system can be tuned to much higher sensitivity, as its sensors will isolate the HCA section from influences elsewhere along the pipeline.
Definition: The failure of a high-pressure natural gas pipeline can lead to various outcomes, some of which can pose a significant threat to people and property in the immediate vicinity of the failure location. The dominant hazard is thermal radiation from a sustained jet or trench fire. An estimate of the ground area affected by a credible worst-case failure event can be obtained from a model that characterizes the heat intensity associated with rupture failure of the pipe where the escaping gas is assumed to feed a sustained trench fire that ignites very soon after line failure.
An equation has been developed that relates the diameter and operating pressure of a pipeline to the size of the area likely to experience high consequences in the event of an ignited rupture failure. The model upon which the hazard area equation is based consists of three parts: 1) a fire model that relates the rate of gas release to the heat intensity of the fire as a function of distance from the fire source; 2) an effective release rate model that provides a representative steady-state approximation to the actual transient release rate; and 3) a heat intensity threshold that establishes the sustained heat intensity level above which the effects on people and property are consistent with the adopted definition of a so-called High Consequence Area.
The validity of the proposed model is established by a comparison between the predicted extent of the damage area and the actual extent of damage for significant gas pipeline failure incidents reported in the public domain.
Definition: The term “OSHA Recordable Injuries” is defined as Recordable work-related injuries and illnesses are those that result in one or more of the following: medical treatment beyond first aid, one or more days away from work, restricted work or transfer to another job, diagnosis of a significant injury or illness, loss of consciousness, or death. Injuries may include cases such as a cut, fracture, or sprain. Illnesses may include both acute and chronic illnesses such as a skin disease, respiratory disorder, or allergy. All needle sticks and sharps injuries involving exposure to blood or other potentially infectious materials are included.
The OSHA Act regulations also indicate that cases involving cancer, chronic irreversible disease, a fractured or cracked bone, or a punctured eardrum must always be recorded. An injury is considered work-related if an event or exposure in the workplace caused or contributed to the condition or significantly aggravated a pre-existing condition. Injuries that are not work-related include those that occur to the general public, certain parking lot accidents, non-work-induced mental illnesses, colds or flu, injuries that arise from personal meals or grooming, injuries that are self-inflicted or from self-medication, and those occurring on the premises due to outside factors (such as a natural disaster).
Definition: The term “OSHA Recordable Illness” is defined as illness that is work- related & if an event or exposure in the work environment caused or contributed to the condition or significantly aggravated a preexisting condition. Work- relatedness is presumed for injuries and illnesses resulting from events or exposures occurring in the workplace, unless an exception specifically applies.
Many employers with more than 10 employees are required to keep a record of serious work-related illnesses. This information helps employers, workers and OSHA evaluate the safety of a workplace, understand industry hazards, and implement worker protections to reduce and eliminate hazards preventing future workplace injuries and illnesses. The records must be maintained at the worksite for at least five years. Each February through April, employers must post a summary of the injuries and illnesses recorded the previous year. Also, if requested, copies of the records must be provided to current and former employees, or their representatives.
Definition: Oil and Gas workers are nearly ten times as likely to die or be seriously injured in a motor vehicle accident on the job as people who work in any other profession. The study, conducted between 2003 and 2009, found that almost one-third of all work-related deaths in the Oil and Gas industry were caused by motor vehicle accidents. The oil industry is inherently dangerous and those dangers are vividly illustrated in the many newsworthy accidents that have been reported across the globe.
The National Institute for Occupational Safety and Health (NIOSH) notes that motor vehicle crashes are responsible for 29 percent of all work-related deaths in the industry. From 2003 to 2009, some 202 Oil and Gas extraction workers died in work-related motor vehicle accidents a rate 8.5 times higher than for private wage and salary workers. Many motor vehicle accidents affecting industry employees occur on sprawling work sites, and the location of those sites is often remote, reached by rural, poorly maintained roads that lack firm shoulders, adequate signage and other safety features. Hauling heavy equipment to out-of-the-way operations or merely going to and from work can be hazardous in itself. Many remote sites lack housing, causing workers to drive many miles and hours sometimes to commute.
Definition: Work in the Oil and Gas industry is associated with many risks. These dangers increase when rig owners negligently attempt to save money, get the job done quicker, or fail to maintain safety protocols. Much offshore gas and oil exploration takes place many miles beneath the ocean. As well as involving some seriously complex equipment, oil platforms can also be dangerous places, with numerous environmental hazards to deal with. Well drilling has taken place for thousands of years, and since then there have been numerous gas related accidents have been reported which have had a serious impact both on human life and the environment. There is a positive side to this, though virtually every accident has led to safety reviews, and helped to improve safety protocols and equipment.
Definition: The term “Drilling Depth” is defined as the original depth recorded while drilling an oil or gas wellIn Other words it is defined as the depth required to drill to extract crude Oil. The average depth of oil wells drilled was 3,635 feet. Since oil takes millions of years to form, for all intents and purposes, it’s a finite resource. Oil and Gas Companies are drilling deeper because they are literally running out of oil. But depth comes at a cost. Deep offshore drilling requires more money and energy, not to mention hazards for both the environment and workers.
Drilling on land is an undertaking on its own. How do you drill in lightless ocean depths and transport all that liquid, gas and solid petroleum back to the surface? How do you keep from polluting the ocean? And how do you do all of this, with tons of special equipment, in the middle of rough seas? Even today, scientists say that oil in the Gulf of Mexico continues to poison wildlife and poses a public risk.
Tracking and recording of drill pipe at the rig site starts when individual joints are picked up. Joint numbers are manually marked on the side of the pipe. Typically three sections of pipe are joined together into a stand (of about 27–29 m in length) and stacked in rows of 10, with their base resting on the drill floor. Prior to running in the hole each stand is manually measured with a steel tape measure and the measurement recorded in a computer spreadsheet (previously a pipe tally book was used) alongside the stand number. To confirm at any stage what depth the drill bit is operating at, the driller consults the pipe tally records, and measures the length of the current stand of drill pipe below the rig floor.
Definition: The term “Non Productive Time” is defined as time during which drilling operation is ceased or penetration rate is very low. Time spent on fishing, pipe stuck, weather, tool transportation, lost circulation and tripping in/out can be counted as Non Productive Time (NPT). No well is drilled without problems. Managing drilling risk means not letting small problems become big ones. Knowing what the risks are and when they are likely to occur keeps surprises to a minimum. Most of the time spent drilling, and most of the cost, is encountered not in the reservoir, but in getting to it. The NPT events have been divided into two categories; geological or subsurface related and other issues or (non- geological related). The NPT events in drilling operations currently account for 18% of total drilling time in the selected wells and the analysis showed that waiting water and lost circulation are major causes of NPT in the selected wells in the Ghadames Basin.
Non-productive time in offshore drilling and completion is a huge cost to the oil industry and, while many causes have been dealt with, tool failure is the main concern. In the complex and capital-intensive world of offshore drilling, downtime is expensive. The cost to oil producers of non-productive time (NPT) is huge, and although the industry has done very well in combating many of the causes, there remain urgent problems to address to ensure efficient operation.
Non Productive Time (NPT) brings to mind money wasted, time wasted, failures, budget overruns, unreliability, breakdowns, inefficiencies, plans gone awry, and many more of the unpleasant elements of a drilling operation. But perhaps NPT is not as bad as it seems.
Definition: The Fuel losses incurred as a result of a catastrophic crude oil spill can sink entire operations, and often make headline news. However, far more revenue is lost through day-to-day shipping incidents and low-level negligence. This can be mitigated through the proper introduction of loss-prevention mechanisms. There are many reasons for the loss of fuel in transit, and therefore a multifaceted approach to ensuring efficiency, profit retention, and safety must be taken.
Fuel losses can sometimes occur due to negligence on basic safety requirements needed for operations. With ever-more rapid technological advancements, the detection and correction of oil handling equipment can be streamlined to guarantee transportation safety. Efficiency can be enhanced through the use of such technology-based tools and equipment that can help monitor any leakages and failures on the oil-carrying vessels. A considerable volume of oil gets wasted during both operations and handling. For this reason, the use of oil tanks should be well planned and diligently monitored to cut down on losses due to evaporation.
Definition: Incidents or Accidents during Lifting and rigging work tasks are called as “Rigging & Lifting Incidents”. Lifting and rigging work tasks are considered a high hazard task by many oil & gas companies. There are a lot of associated hazards that accompany lifting any loads with cranes or equipment. It is important to not only understand proper rigging techniques, but also the other hazards that accompany this type of work task.
The first type of incident regarding lifting and rigging is some type of breakage of a sling, wire rope, or chain resulting in a dropped load. While these type of incidents usually have the most severe consequences, there are often many other types of less severe incidents that cause the majority of injuries or property damage. Some of the other injuries and incidents that occur are sprains, falls, crush injuries, electrocutions, and struck-by incidents.
Hazards such as swinging loads, manual handling of heavy rigging, holding on to tag lines, moving equipment, pinch points, working on elevated surfaces, trip hazards, slippery surfaces, etc. can all be present during lifting operations.
Definition: The term “Production Spend” is defined as the amount that an Oil and Gas company spends in crude oil production. For decades, higher production from oil companies was what the market wanted and rewarded. But in the last couple of years, it has become clear that what is desired, often voiced and certainly rewarded, is slower production growth and reined-in spending.
Unconventional production from shale, particularly shale oil, are the product of years of innovation. In particular, during the industry downturn between 2015-2017, E&P companies hacked away at their spend and forced down their breakeven prices. The industry has more than doubled production since 2011, and the fastest growth has been in the last couple of years.Definition: The term “Research & Development Spend” is defined as the amount that an Oil and Gas company typical spends on research & development activities. Research and Development spend reflects a company’s commitment to long-term growth through innovation. Companies sacrifice short-term earnings to develop innovative technologies to stay ahead of their peers.
Research & Development is a leading indicator of the direction of change in an industry. But even as Shell and its oil major peers say they are preparing for a greener future, their spending is still largely focused on their legacy fossil fuels businesses. Royal Dutch Shell’s research and development center in Amsterdam, scientists and engineers are experimenting with new ways to thrive as the world shifts towards cleaner fuels from hydrogen dispensers at fueling stations to injecting carbon back into underground reservoirs after Oil and Gas extraction.
Statistic show that Royal Dutch Shell's spending on research and development ranges 900 to 1400 million US Dollars. In 2010, the company spent some 1.02 billion U.S. dollars on R&D. Royal Dutch Shell is one of the leading Oil and Gas companies worldwide, operating in every segment of the Oil and Gas industry. The company is headquartered in the Hague, Netherlands. In 2018, R&D spending was 986 million U.S. dollars.
Definition: A utility derived from every purchase or every sum of money spent. Spend Value for money is based not only on the minimum purchase price (economy) but also on the maximum efficiency and effectiveness of the purchase. The oil and gas sector plays an important role in the economy by drilling, extracting, and processing Oil and Gas. Because operational spend vary widely with the size of Oil and Gas companies, average operating expenses tend to be meaningless.
Financial professionals typically assess the average operational spend by looking at the average operational spend margin, which is expressed as the percentage of operational spend in the sector's total revenues. In July 2015, the average operational spend margin for the Oil and Gas industry was approximately 33%. Given the average revenue of $60 billion over the last four quarters, the average operating expense in the Oil and Gas sector stands at approximately $19.5 billion per company.
Definition: The term “Spend Growth Rate” is defined as the rate at which an Oil and Gas company spends in exploration, production & development activities. The Oil and Gas sector plays an important role in the economy by drilling, extracting, and processing Oil and Gas. Because operational spend vary widely with the size of Oil and Gas companies, average operating expenses tend to be meaningless.
Financial professionals typically assess the average operational spend by looking at the average operational spend margin, which is expressed as the percentage of operational spend in the sector's total revenues. In July 2015, the average operational spend margin for the Oil and Gas industry was approximately 33%. Given the average revenue of $60 billion over the last four quarters, the average operating expense in the Oil and Gas sector stands at approximately $19.5 billion per company.
Definition: The term “Purchase Order Accuracy” is defined as the Percentage of purchase orders with line item, pricing, supplier data, quantity or delivery date and address errors over total number of purchase orders per period of time. Can be different for different buying channels. Purchase order accuracy is necessary for the manufacturing planners to know when the raw materials will be available to release the required manufacturing orders. If items are purchased and then distributed to customers, having accurate purchasing information allows the ATP and CTP functions to accurately project when a customer may expect an order.
The process to validate purchase orders is very similar to the process to validate work orders and sales orders. This is an ongoing operation where the problem orders will quickly rise to the top as past due. Similar to the process for customer demand, examine the first page of a purchase order listing by due date. All purchase orders should have an expected delivery date that is sometime in the future. Realizing that not all suppliers are on time with all deliveries, means that this process must be under constant review to ensure that valid due dates are being fed into the system initially and maintained with the passage of time.
Definition: The “Supplier Corrective Action Request (SCAR)” is the is a systematic approach to request investigation of a problem that already happened and request root cause analysis and resolution from supplier to prevent recurrence. A supplier quality action report (SCAR) was derived from the need to issue suppliers a corrective action to a problem that occurred due to their product or service. As a way to differentiate this from an internal corrective action, somebody out there decided to call it a SCAR. Basically, it’s a formal request to a supplier to correct a problem and explain exactly how it will do so. The Time taken for resolution of problem that already happened and request root cause analysis is termed as “SCAR Resloution Time”
Definition: The “Supplier Corrective Action Request (SCAR)” is the is a systematic approach to request investigation of a problem that already happened and request root cause analysis and resolution from supplier to prevent recurrence. A supplier quality action report (SCAR) was derived from the need to issue suppliers a corrective action to a problem that occurred due to their product or service. As a way to differentiate this from an internal corrective action, somebody out there decided to call it a SCAR. Basically, it’s a formal request to a supplier to correct a problem and explain exactly how it will do so. The Time taken for respond to a problem that already happened and request root cause analysis is termed as “SCAR Response Time”
Definition: The term “On-Time Delivery” is a measure of process and supply chain efficiency which measures the amount of finish goods or services delivered to customers on time and in full. It helps determine how efficiently we are meeting our customer's or agreed deadlines. If the figure is too low or below the benchmark it could be used as a signal that somewhere along the supply chain there are bottlenecks, inefficient or time consuming processes which are not adding value and warrant further investigation or a slower delivery method is being employed.
On-Time delivery is a very simple measure but sometimes overlooked in many organizations, and it is simply calculated as the amount of units or shipments delivered on time versus total orders shipped. On-time delivery (OTD) is a key metric to measure delivery performance and supply chain efficiency in any company. The On-time delivery performance refers to the ratio of customer order lines shipped on or before the requested delivery date / customer promised date versus the total number of order lines. This is usually expressed as a percentage and can be calculated for several measurement periods.
Definition: The term “Vendor Score” is an aggregate rating of the various quality-related performance metrics for the supplier. Scores for various quality metrics are multiplied by their weighting and the summation provides the overall quality score for the supplier. Vendor Score is an evaluation metric used to assess the performance of suppliers. Vendor Score can be used to keep track of item quality, delivery and responsiveness of suppliers across long periods of time. This data is typically used to help in purchasing decisions. A Vendor Score is manually created for each supplier.
Definition: The “Rate of Quality Delivery” is one of the performance measure to evaluate Supplier performance. It measures whether your supplier is doing their work as expected at a right time. As levels of supply chain integration have increased and inventory levels have been reduced, reliable, on-time deliveries have become increasingly critical for success.
Large inventories and production capacities were traditionally required to ensure on-time delivery. However, with advanced information systems, deregulation, agile manufacturing organizations with flexible equipment and tooling, and sophisticated logistics systems, integrated supply chains no longer need large, costly inventory buffers to respond to unexpected events and variations in demand.
Definition: The term “Billed Revenue” means the aggregate amounts billed to customers and clients by the Purchased Subsidiaries and their Subsidiaries or by any Affiliate of the Buyer to the extent such billings arise out of the Business. Uncollectable Revenue is defined as total Billed Revenue that is uncollected and past due, and includes bad debts, fraudulent charges, short payments by Users, and other payment shortfalls and delinquencies.
Revenue recognition, particularly for upstream activities, can present challenging issues. Production often takes place in joint ventures or through concessions, and entities need to analyze the facts and circumstances to determine when and how much revenue to recognize. Crude Oil and Gas may need to be moved long distances and need to be of a specific type to meet refinery requirements
Definition: The term “Unbilled Revenue” is defined as the revenue that has been earned by providing a good or service, but for which no payment has been received because the customer has yet to be billed. Billed revenues are recorded as receivables on the balance sheet to reflect the amount of money that customers owe the business for the goods or services they purchased.
Billed Revenue is a feature of accrual accounting and the matching principle, which is an accounting concept that matches revenues with expenses, regardless of when cash transactions occur. It requires that transactions be recorded in the same accounting period in which they are earned, rather than when the cash payment for the product or service is received. Under generally accepted accounting principles (GAAP), Billed revenue is recognized when the performing party satisfies a performance obligation, ie., a sale has occurred and is finalized.
Revenue recognition, particularly for upstream activities, can present challenging issues. Production often takes place in joint ventures or through concessions, and entities need to analyze the facts and circumstances to determine when and how much revenue to recognize. Crude Oil and Gas may need to be moved long distances and need to be of a specific type to meet refinery requirements
Definition: The term “Cost of Restoration” is defined as the cost of restoring a damaged, lost or destroyed Asset or Equipment's to a condition reasonably comparable to its pre-Casualty Loss condition. Cost of Restoration includes:
Definition: The term “Cost of Replacement” is defined as an expense a business must undertake to replace an essential asset of the company at the same or equal value. The asset to be replaced could be equipment, machines, investment securities, accounts receivable or liens. The replacement cost can change, depending on changes in the market value of the asset and any other costs required to prepare the asset for use. Accountants use depreciation to expense the cost of the asset over its useful life.
Replacing an asset can be an expensive decision, and companies analyze the net present value (NPV) of the future cash inflows and outflows to make purchasing decisions. Once an asset is purchased, the company determines a useful life for the asset and depreciates the asset's cost over the useful life. As part of the process of determining what asset is in need of replacement and what the value of the asset is, companies use a process called net present value. To make a decision about an expensive asset purchase, companies first decide on a discount rate, which is an assumption about a minimum rate of return on any company investment.
Reserve replacement cost (RRC) is calculated by dividing development, exploitation, exploration and acquisition capital expenditures, reduced by proceeds of divestitures, for the period by net estimated proved reserve additions for the period from all sources, including acquisitions and divestitures. Our calculation of reserve replacement cost includes costs and reserve additions related to the purchase of proved reserves.
Definition: The term “Operating Revenue” is defined as the revenue generated from a company's primary business activities. Distinguishing operating revenue from total revenue is important as it provides valuable information about the productivity and profitability of a company's operations. Despite recording operating revenue separately on financial statements, some firms may attempt to mask decreases in operating revenue by combining it with non-operating revenue. Understanding and identifying the sources of revenue is helpful in assessing the health of a firm and its operations.
Operating Revenues are the result of the sale of production, oil & gas, from the wells. Operating Revenues can also result from services provided or the gains on equipment sold. Cost of Goods Sold are the costs related to the sales of production or services provided. Expenses are the costs incurred in order to operate the wells and company. Because Operating Revenue vary widely with the size of Oil and Gas companies, average operating revenue tend to be meaningless. Financial professionals typically assess the average operating revenue by looking at the average operating revenue margin, which is expressed as the percentage of operating revenue in the sector's total revenues.
Definition: The term “Operating Expense” is defined as the is an expense a business incurs through its normal business operations. Often abbreviated as OPEX, operating expenses include rent, equipment, inventory costs, marketing, payroll, insurance, and funds allocated for research and development. One of the typical responsibilities that management must contend with is determining how to reduce operating expenses without significantly affecting a firm's ability to compete with its competitors.
The Oil and Gas sector plays an important role in the economy by drilling, extracting, and processing Oil and Gas. Because operating expenses vary widely with the size of Oil and Gas companies, average operating expenses tend to be meaningless. Financial professionals typically assess the average operating expenses by looking at the average operating expenses margin, which is expressed as the percentage of operating expenses in the sector's total revenues. In July 2015, the average operating expenses margin for the oil and gas industry was approximately 33%. Given the average revenue of $60 billion over the last four quarters, the average operating expense in the Oil and Gas sector stands at approximately $19.5 billion per company.
Definition: The term “Maintenance Cost” is defined as costs incurred to keep an item in good condition or good working order. When purchasing an item that requires upkeep consumers should consider the initial price tag as well as the item's ongoing maintenance expenses. Such Costs are major reasons why home ownership can be more costly than renting. Sometimes items that are merely leased and not owned, such as a leased car, will require the operator to pay maintenance costs.
The significant lifetime cost of equipment maintenance after initial purchase can be shocking in the Oil and Gas world. Whether it be upstream, midstream or downstream, there are standard practices and routine maintenance procedures that must be conducted. Scheduled shutdowns, for example, mean that production is paused so that maintenance teams can inspect machines based on manufacturer-recommended schedules (even if the machines are in perfect working condition). If something happens in the period of time between those planned inspections, we firefight.
Definition: The term “Maintenance Cost” is defined as the value of a fixed asset net of all accumulated depreciation that has been recorded against it. In a broader economic sense, the depreciated cost for industry is the aggregate amount of capital that is "used up" in a given period, such as a fiscal year. This value can be examined for trends in capital spending and accounting aggressiveness, which can be useful in assessing competitive profiles. It is also known as the "salvage value," "net book value," or "adjusted cost basis.“
Inventory that is sold appears in the income statement under the COGS account. The beginning inventory for the year is the inventory left over from the previous year that is, the merchandise that was not sold in the previous year. Any additional productions or purchases made by a manufacturing or retail company are added to the beginning inventory. At the end of the year, the products that were not sold are subtracted from the sum of beginning inventory and additional purchases. The final number derived from the calculation is the cost of goods sold for the year.
Oil and Gas company are affected by periodic charges for depreciation, depletion, and amortization (DD&A) of costs relating to expenditures for the acquisition, exploration, and development of new oil and natural gas reserves. They include the depreciation of certain long-lived operating equipment, the depletion of costs relating to the acquisition of property or property mineral rights, and the amortization of tangible non-drilling costs incurred with developing the reserves.
Definition: The term “Cost of Goods Sold” is defined as the direct costs attributable to the production of the goods sold in a company. This amount includes the cost of the materials used in creating the good along with the direct labor costs used to produce the good. It excludes indirect expenses, such as distribution costs and sales force costs.
Upstream Oil and Gas industry products oil, natural gas, and natural gas liquids can be measured as barrels of oil equivalent (BOE), allowing for the comparison of unit prices and costs. Gross margin is defined as revenue minus cost of goods sold (COGS) divided by revenue, which can be translated into per-BOE values.
Definition: The term “Operating Expense” is defined as the is an expense a business incurs through its normal business operations. Often abbreviated as OPEX, operating expenses include rent, equipment, inventory costs, marketing, payroll, insurance, and funds allocated for research and development. One of the typical responsibilities that management must contend with is determining how to reduce operating expenses without significantly affecting a firm's ability to compete with its competitors.
The Oil and Gas sector plays an important role in the economy by drilling, extracting, and processing Oil and Gas. Because operating expenses vary widely with the size of Oil and Gas companies, average operating expenses tend to be meaningless. Financial professionals typically assess the average operating expenses by looking at the average operating expenses margin, which is expressed as the percentage of operating expenses in the sector's total revenues. In July 2015, the average operating expenses margin for the oil and gas industry was approximately 33%. Given the average revenue of $60 billion over the last four quarters, the average operating expense in the Oil and Gas sector stands at approximately $19.5 billion per company.
Definition: The term “Gross Sales Growth Rate” is defined as the percentage change of Gross Sales within a specific time period and given a certain context. For investors, growth rates typically represent the compounded annualized rate of growth of a company's revenues, earnings, dividends or even macro concepts, such as gross domestic product (GDP) and sales. Expected forward-looking or trailing gross sales growth rates are two common kinds of growth rates used for analysis. At their most basic level, Gross Sales growth rates are used to express the annual change in Sales growth as a percentage.
Definition: The term “Selling Expenses” is defined as a cost incurred to promote and market products to customers. These costs can include anything from advertising campaigns and store displays to delivering goods to customers. Any expense that is associated with selling a good or making a sale is considered a selling expense. Selling expenses are traditionally listed before general and administrative expenses because investors and creditors are typically more concerned about the costs related to producing income. General and admin expenses are still important, but they don’t actually produce any sales.
Selling expenses are categorized as indirect expenses on a company’s income statement because they do not contribute directly to the making of a product or delivery of a service. Some components can change as sales volumes increase or decrease, while others remain stable. Hence, selling expenses are considered to be semi-variable costs (as opposed to fixed or variable costs).
Definition: The term “General & Admin Expenses” represent the necessary costs to maintain a company's daily operations and administer its business, but these expenses are not directly attributable to the production of goods and services. Information on this type of expense is especially useful when calculating a company's fixed costs.
General & Admin expenses typically refer to expenses that are still incurred by a company, regardless of whether the company produces or sells anything. This type of expense is shown on the income statement, typically below cost of goods sold (COGS) and lumped with selling expenses, forming a selling, general and administrative expense line item.
There has been continuous focus to streamline the General & Admin Expenses in the Oil and Gas Upstream companies as these type of expenses rose over the time frame other than significant increase in the production as well as development costs. General & Admin Expenses can be either Support related (HR, Head office, administration, accounting etc.) or Technical and/or Operating types like exploration, development or EHS related costs etc.
Definition: The term “Interest Expense” is defined as the cost incurred by an entity for borrowed funds. Interest expense is a non-operating expense shown on the income statement. It represents interest payable on any borrowings bonds, loans, convertible debt or lines of credit. It is essentially calculated as the interest rate times the outstanding principal amount of the debt. Interest expense on the income statement represents interest accrued during the period covered by the financial statements, and not the amount of interest paid over that period. While interest expense is tax-deductible for companies, in an individual's case, it depends on his or her jurisdiction and also on the loan's purpose.
Definition: The term “Cash Flow” is the net amount of cash and cash equivalents being transferred into and out of a company. Positive cash flow indicates that a company's liquid assets are increasing, enabling it to settle debts, reinvest in its business, return money to shareholders and pay expenses. Cash flow is reported on the cash flow statement, which contains three sections detailing activities. Those three sections are cash flow from operating activities, investing activities and financing activities.
The number one measure of performance in oil and gas producers is core Cash Flow. This allows for increased certainty in meeting debt obligations (the oil industry generally carries larger levels of debt). Future cash flows also help to value a company on a monthly or yearly basis. Oil and Gas reports a very high level of costs associated as non-cash items. Depreciation, depletion and amortization coupled with a large amount of deferred taxes are good reasons to use cash flow as the dominant measure for success and not net income. Commodity prices can move up or down significantly in a short period of time. Weather, inventories, and supply and demand can all affect pricing
Definition: The term “Income” is money (or some equivalent value) that an individual or business receives in exchange for providing a good or service or through investing capital. Income is used to fund day-to-day expenditures. In businesses, income can refer to a company's remaining revenues after paying all expenses and taxes. In this case, income is referred to as "earnings.” Most forms of income are subject to taxation.
The Oil and Gas, income is generally a royalty. Unless you are the owner of a large Oil and Gas corporation, your oil and gas income is generally from a royalty, which is a percentage of the total income that you receive when resources are extracted from your property or from a mineral right in which you own an interest. Some areas, such as the eastern half of Ohio, contain hydrocarbon deposits, which are oil and natural gas. When a property contains these natural resources, a contracted oil production company will drill and extract these resources.
Definition: The term “Interest Expense” is defined as the cost incurred by an entity for borrowed funds. Interest expense is a non-operating expense shown on the income statement. It represents interest payable on any borrowings bonds, loans, convertible debt or lines of credit. It is essentially calculated as the interest rate times the outstanding principal amount of the debt. Interest expense on the income statement represents interest accrued during the period covered by the financial statements, and not the amount of interest paid over that period. While interest expense is tax-deductible for companies, in an individual's case, it depends on his or her jurisdiction and also on the loan's purpose.
Definition: The term “Cash on Hand” is defined as Funds that are immediately available to a business, and can be spent as needed, as opposed to assets that must be sold to generate cash. The amount of cash on hand determines what projects a company can undertake, or what financial hardships can be absorbed, without going into debt or arranging other financing.
The Current ratio is a liquidity ratio used to determine a company's financial health. The metric illustrates how easily a firm can pay back its short obligations all at once through current assets. A company that has a current ratio of one or less is generally a liquidity red flag. This doesn't mean the company will go bankrupt tomorrow, but it also doesn't bode well for the company, and may indicate that it could have an issue paying back upcoming obligations.
The Quick ratio measures a company's ability to use its cash on hand or assets to extinguish its current liabilities immediately. Quick assets include assets that presumably can be converted to cash at close to their book values. A company with a Quick Ratio of less than 1 cannot currently pay back its current liabilities
Definition: The term “Gross Profit” is the profit a company makes after deducting the costs associated with making and selling its products, or the costs associated with providing its services. Gross Profit will appear on a company's income statement and can be calculated by subtracting the cost of goods sold (COGS) from revenue (sales). These figures can be found on a company's income statement. Gross profit assesses a company's efficiency at using its labor and supplies in producing goods or services. The metric only considers variable costs that is, costs that fluctuate with the level of output.
Typically, gross profit margin does not account for other costs such as energy, chemicals/catalysts, labor, materials, or fixed costs. However, sometimes the fuel generated by the refinery will be included in the product value in gross profit, margin and then also included in the energy cost when calculating variable cash margin. This has the effect of inflating the gross profit margin measure. Gross profit margin is the metric most useful in assessing the direct effect of market conditions on refinery economics, separate from the effects of operational performance.
Definition: The term “Net Cash” is the final amount of a company's total cash minus total liabilities reported on financial statements. It is commonly used in evaluating a company's cash flows. Net cash also refers to the amount of cash remaining after a transaction has been completed and all associated charges and deductions have been subtracted. Net cash may also be considered the short form when referring to net cash per share as it relates to stock investing. The term can be modified to distinguish the function of the funds, such as net cash flow, which describes incoming funds received within a period. Investors can use net cash to help determine whether a company's stock is an attractive investment, and it may be used in conjunction with other measures to gauge the company's overall liquidity.
Net cash flow is basically revenue minus costs. The most commonly used model in the Oil and Gas industry to determine profit is the NCF model since this model incorporates the time value of money. Profit in the cash-flow model is also referred to as net cash flow (NCF). The NCF model has one unique feature and this unique piece is called time zero.
Time zero is the day that the check is written to the contractors to perform a job. CAPEX is placed in time zero in the NCF model. It is very important that the cash-flow model is used for economic analysis, since it incorporates the time value of money. Profit excluding investment is referred to as operating cash flow.
Definition: The term “Net Cash Burn” is the rate at which a company is losing money. It is calculated by subtracting its operating expenses from its revenue. It is also usually stated on a monthly basis. It shows how much cash a company needs to continue operating for a period of time. However, one factor that needs to be controlled is the variability in revenue. A fall in revenue with no change in costs can lead to a higher burn rate.
Higher Net Cash Burn suggests that a company is depleting its cash supply at a faster rate. It indicates that is it at a higher likelihood of entering a state of financial distress. This may suggest that investors will need to more aggressively set deadlines to realize revenue given a set amount of funding. Alternatively, it would mean that investors would be required to inject more cash into a company for it to realize revenue.
It is true that capital expenditures are the main reason that Free Cash Flow go deeply negative for so many companies in recent years. When oil prices were $100 a barrel, oil companies invested every penny they could get their hands on into producing more oil. There were no guarantees of how long the high prices would last, but it’s understandable why they were plowing all their cash back into their business.
Definition: The term “Asset” is a resource with economic value that a corporation or country owns or controls with the expectation that it will provide a future benefit. Assets are reported on a company's balance sheet and are bought or created to increase a firm's value or benefit the firm's operations. An asset can be thought of as something that, in the future, can generate cash flow, reduce expenses, or improve sales, regardless of whether it's manufacturing equipment or a patent.
An Asset represents an economic resource for a company or represents access that other individuals or firms do not have. A right or other access is legally enforceable, which means economic resources can be used at a company's discretion, and its use can be precluded or limited by an owner. For an asset to be present, a company must possess a right to it as of the date of the financial statements. An economic resource is something that is scarce and has the ability to produce economic benefit by generating cash inflows or decreasing cash outflows.
Oil company assets are classified into three main divisions: upstream, midstream and downstream. Upstream operations are the exploration for Oil and Gas and the appraisal, development and production of any discovery, and most oil companies do not own equipment for upstream activities; they hire contractors to perform services such as geophysical surveys, well drilling and geological and environmental studies. Midstream assets are linked to the initial processing, storage and transportation of oil and gas. Crude oil refining into products such as gasoline, kerosene and diesel is a downstream activity, as is the product distribution to and marketing by a retail network.
Definition: The term “Liability” in general, is an obligation to or something that you owe somebody else. Liabilities are defined as a company's legal financial debts or obligations that arise during the course of business operations. Liabilities are settled over time through the transfer of economic benefits including money, goods, or services. Recorded on the right side of the balance sheet, liabilities include loans, accounts payable, mortgages, deferred revenues, and accrued expenses.
A liability is an obligation between one party and another not yet completed or paid for. A financial liability is also an obligation but is more defined by previous business transactions, events, sales, exchange of assets or services, or anything that would provide economic benefit at a later date. Liabilities are usually considered short term (expected to be concluded in 12 months or less) or long term.
Environmental liabilities are legal obligations arising under laws designed to protect human health and the environment. E&P has historically received favorable treatment under U.S. federal and state environmental remediation laws. Wastes generated during the exploration, development, and production of crude oil, natural gas, and geothermal energy are exempt from federal hazardous waste regulations under the Resource Conservation and Recovery Act. Significant liabilities may stem from sudden and accidental releases such as the Gulf Oil Spill, the lion’s share of E&P environmental liabilities are decommissioning, plugging and abandonment obligations incurred in the normal course of operations.
Definition: The term “Working Capital Ratio” is a measure of liquidity, revealing whether a business can pay its obligations. The ratio is the relative proportion of an entity's current assets to its current liabilities, and shows the ability of a business to pay for its current liabilities with its current assets. A working capital ratio of less than 1.0 is a strong indicator that there will be liquidity problems in the future, while a ratio in the vicinity of 2.0 is considered to represent good short-term liquidity.
The working capital ratio can be misleading if a company’s current assets are heavily weighted in favor of inventories, since this current asset can be difficult to liquidate in the short term. This problem is most obvious if there is a low inventory turnover ratio. A similar problem can arise if accounts receivable payment terms are quite lengthy (which may be indicative of unrecognized bad debts).
The degree of working capital tied up by the Oil and Gas industry has grown substantially over the past six years. Working capital among Oil and Gas companies in terms of cash-to-cash (C2C) grew from 24.9 to 32.0 days, an increase of 7.1 days or 29 percent between 2003 and 2009. While the expansion of the industry-wide C2C cycle was driven by 20 of the 34 companies surveyed, the difference between the best performers and laggard performers is considerable.
Definition: The term “Debt Ratio” is a financial ratio that measures the extent of a company’s leverage. The debt ratio is defined as the ratio of total debt to total assets, expressed as a decimal or percentage. It can be interpreted as the proportion of a company’s assets that are financed by debt. A ratio greater than 1 shows that a considerable portion of debt is funded by assets. In other words, the company has more liabilities than assets. A high ratio also indicates that a company may be putting itself at a risk of default on its loans if interest rates were to rise suddenly. A ratio below 1 translates to the fact that a greater portion of a company's assets is funded by equity.
Oil and Gas operations are very capital-intensive, yet most Oil and Gas companies carry relatively small amounts of debt, at least as a percentage of total financing. This can be seen in debt ratios. It is not that all oil companies are involved in the same operations. A company's position along the supply chain influences its Debt ratio. Debt Ratio reflects the degree to which a company is leveraged. In other words, it shows how much of the company's financing results from debt as opposed to equity. Generally speaking, higher ratios are worse than lower ratios, though these higher ratios may be more tolerable for large firms or certain industries.
Definition: The term “Liquidity Ratio” is defined as an important class of financial metrics used to determine a debtor's ability to pay off current debt obligations without raising external capital. Liquidity ratios measure a company's ability to pay debt obligations and its margin of safety through the calculation of metrics including the current ratio, quick ratio, and operating cash flow ratio.
Current liabilities are analyzed in relation to liquid assets to evaluate the coverage of short-term debts in an emergency. Liquidity is the ability to convert assets into cash quickly and cheaply. Liquidity ratios are most useful when they are used in comparative form. This analysis may be internal or external. For example, internal analysis regarding liquidity ratios involves using multiple accounting periods that are reported using the same accounting methods. Comparing previous time periods to current operations allows analysts to track changes in the business. In general, a higher liquidity ratio shows a company is more liquid and has better coverage of outstanding debts.
If there is one lesson to be learned from the deep drop in oil prices over the past year, it's that liquidity matters. A key difference between the average oil stock and Approach Resources, Carrizo Oil & Gas, and Penn West Petroleum is that the trio have the most dangerous liquidity ratios among this sector,
Definition: The term “Leads Created” is the marketing process of stimulating and capturing interest in a product or service for the purpose of developing sales pipeline. Lead creation often uses digital channels, and has been undergoing substantial changes in recent years from the rise of new online and social techniques. In particular, the abundance of information readily available online has led to the rise of the “self-directed buyer” and the emergence of new techniques to develop and qualify potential leads before passing them to sales.
In a perfect world, the company would send a message and consumers and businesses would hear it, then flock to you with checkbooks in hand. Unfortunately, that’s not the way the sales process works in the real world. Before a transaction occurs, your company has to go through a process of generating familiarity, trust, and interest in your products and services. You have to generate new leads, then move them through the sales funnel. The sales funnel for Oil and Gas companies is often a long one.
You need to show what you have to offer, and if it matches what a potential client is looking for, they’ll consider starting negotiations. It can be a long process, but the result is a mutually beneficial partnership. But before you can begin to move clients through the sales funnel, you need to open the lines of communication a process called lead creation or generation.
Definition: The term “Opportunities Won” is the stage of the sales funnel in which a contact has inked the deal and become a customer. In other words, an opportunity that had a certain percentage possibility of becoming a closed deal at the start of the funnel is now 100% certain to end with a sale. It’s opposite, the closed-lost opportunity, is where contact with the sales prospect has been terminated, and there is now a 0% chance of a sale. While, of course, the closed-won opportunity represents the successful end stage of a sales cycle, there are elements and techniques that lead to a close won deal. When teams are prospecting sales whether attempting to cold-call new sales prospects or cultivating old leads closed-won deals are likely when they use more than one team member and establish strong connections through repeat communications.
Definition: Open Deals provide a finer focus for promotional activities. Example a Sales Promotion includes separate sales deals for each product line. Within the sales deal for a product line you might want to be able to promote the products in different ways. You might, for example, want to offer customer-specific discounts in some cases and material-based discounts in others. You can then create specific condition records that are linked to the sales deal, or assign existing condition records. If the sales deal is linked to a promotion, the condition record also contains the number of the promotion. This makes it possible later on, for example, to list and analyze all the condition records that refer to a particular promotion
Sick wells are shut-in producers or underperforming wells. Around 20% of the wells of any oil or gas field are sick due to mechanical failure, formation damage, reservoir problems, water encroachment, completion concerns, or lifting problems. Reviving these sick wells involves an integrated asset team. They rank and analyze a large volume of different data types from multiple domains, identify the cause and revival methods of the sick wells, and estimate production gains and losses. However, this strategy has the following limitations:
Well modeling estimates the pressure profile [pressure at different points along with tubing (pipeline)] along the wellbore. This pressure profiling, along with nodal analysis, estimates the production rates (oil and gas) of the well. The conditions prevailing at the wall, or in the neighborhood of a borehole, often influence the selected development scheme of a field and the completion procedures used for each well.
Aside from the geometry of the borehole, the magnitude and orientation of the in situ stresses and reservoir rock behavior, engineer intrusion impacts the stress concentrations of the drilling operation. This introductory discussion includes stability considerations of far-reaching and horizontal, completions. We then consider the extreme case of a borehole drilled in an environment leading to the irremediable failure of the surrounding rock, due either to the low strength of the formation or complications in situ stress conditions.
After the computation of the broken zone extension, a practical discussion of the applications is in order. This communication further addresses the effects of anisotropy, pre-existing discontinuities, and coupling phenomena, such as poroelasticity and thermoporoelasticity. Finally, the agenda of this keynote address is to consider several aspects throughout the life of the reservoir. The coupled simulations provide insight into wellbore stability, sand production, casing design and time-dependent collapse, hydraulic fracturing, and naturally fractured reservoirs. This keynote address covers many of these aspects.
The fluids most often encountered in oil well production operations are hydrocarbons and water. These can be in either liquid or gaseous state, depending on prevailing conditions. As conditions like pressure and temperature change along the flow path (while fluids are moving from the well bottom to the surface), phase relations and physical parameters of the flowing fluids continuously change as well.
To determine operating conditions or to design production equipment, it is essential to describe the fluid parameters affecting the process of fluid lifting. Further sections include calculation methods to determine the physical properties of an oil, water, and natural gas.
Naturally, using actual well data is the most reliable approach to calculating accurate fluid properties. Collecting such data involves pVT measurements and using delicate instrumentation. In most cases, such data are incomplete or missing entirely. Therefore, one must rely on previous correlations. The purpose of the data is to provide a theoretical background and practical methods to calculate fluid properties for rod pumping calculations. Only black-oil hydrocarbon systems encountered in pumping wells receive investigation.
Field Analysis, or Oilfield solids and deposits analysis are a necessary and immediate water management strategy of oil and gas companies. Monitoring the quality of vital oil and gas production fluids and addressing irregularities is a rigorous undertaking. The discovery of unknown bodies in these fluids can disrupt production, jeopardize process integrity, and may require costly equipment or vessel repair, intervention, or replacement.
When the presence of contaminated water visibly infiltrates offshore platforms or structures, a fast, efficient analysis is crucial. With an established history of unknown organic and inorganic samples, your business can benefit from our world-class knowledge and timely services. Oilfield solids and deposits analysis include:
These are also some of our proficiencies:
Oil price, OPEX, royalty, and tax are measures that rank a sick oil well. Oil price refers to the spot price of one barrel of the benchmark crude oil. The grade, location, and sulfur content determine the price of oil. The balance between demand and supply determines the price of oil. Large companies engage in a strategy called “oil storage trade” in which they purchase large quantities of oil for instant storage and delivery before selling it when prices rise.
Operational Expenditure consists of incurred business expenses to smoothly operate daily during the process of turning inventory into an end product. Depreciation of utilized, fixed assets during the production process is part of the operational expenditure process. The operating expenditure, revenue expenditure, or operating expenses refer to OPEX.
Oil and Gas Royalty refers to funds received from the production of oil or gas, free of costs, except taxes. Oil and Gas royalties are also the cash value paid by a lessee to a lessor or to one who has acquired possession of royalty rights, based on a percentage of gross production from the property, free and clear of all costs.
Tax is a compulsory financial charge or levy imposed upon a taxpayer (an individual or other legal entity) by a governmental organization to fund various public expenditures. A failure to pay, along with evasion or resistance to taxation is punishable by law. Taxes consist of direct or indirect taxes. One can pay taxes with money or labor.
Pressure profiling across the strong is a calculation derived from pressure losses across the string.
Pressure loss happens in the string due to three causes:
Different industry correlations estimate the pressure losses in the string. Examples of these correlated estimates include Beggs and Brills, Petroleum Experts, Mukherjee, and Brills. Matching correlated and actual field data helps with calculating the pressure at the nodes to determine the production rates, using nodal analysis.
Two different speeds, such as 25 rpm and 50 rpm of the step motor determine the calculation of the interface profile. They represent the slow and average speed of the mannequin limb movement. Changing the levels of the movement speed does not impact the interface pressure profile because the difference in the level of the speed is low. Thus, level changes may not play a major role in changing the frictional characteristics of yarns and fibers at contact points. Hence, there is no significant effect on the following:
Decline Curve is a method for estimating reserves and predicting the rate of oil or gas production. It typically shows the pace at which production is expected to decline over the lifetime of an energy asset. Knowing the decline curve enables a producer to estimate:
In aggregate, the decline curve can also help determine the rate of production for a total reservoir or even multiple reservoirs. It rests is a method used to determine estimated ultimate recovery (EUR) for an oil or gas reserve.
Theoretically, the decline curve can apply to most wells in the industry. Underlying the decline curve equations is an expectation that well-production typically follows a three-part pattern:
Pipelines transport oil, gas, and other liquids across land and underwater, through an integrated pipeline network. Oil and gas pipeline management analysis helps with maintaining pipeline infrastructure and ongoing daily operations. Oil and gas pipeline management is necessary to reduce the chances of leakage in pipelines spread over thousands of miles. Moreover, the oil and gas pipeline management plays an important role in automation and security as the software may include SCADA (Supervisory Control and Data Acquisition).
Gas and liquid pipeline operators are facing an increased complexity of an already dynamic system. Safe Pipeline solution addresses the following main challenges:
System Obsolescence: The aging SCADA systems run obsolete versions of hardware, operating system, and SCADA applications. Flow Safe Pipeline provides a sustainable solution in the following ways:
Maintaining important onshore and offshore permits and leases is crucial to the success of upstream and downstream businesses in the oil and gas sectors. Managing those assets effectively and with minimal risk challenges companies, particularly when confronted with these dynamics:
Inconsistent, incomplete, and unreliable inventory of tenure, land, agreements, and associated obligations result in missed deadlines or uninformed decisions. The company needs protection against loss associated with missing requirements or obligations to avoid losing future revenues, access to land/mineral resources, or even to property and other investments.
By ensuring all land tracts, lease, and permitting data is accurate and available in a central repository and accessible by relevant stakeholders to ensure timely business decisions are possible. Viewing and generating reports on your land-related assets, including mineral and surface assets, and their respective agreements and obligations are essential. Accurate analysis and reporting of ownership interests in both developed and undeveloped areas are also critical to long-range forecasting and planning.
Managing obligations under various regulatory frameworks in multiple jurisdictions is often complex and time-consuming. Failure to meet lease and permit obligations can potentially lead to the loss of important company assets and negatively impact the company’s bottom line. Thoroughly and accurately following all compliance obligations brings about peace of mind.
The oil and gas industry, potentially one of the most hazardous industry sectors, needs to have the most thorough safety programs. The combination of powerful equipment, flammable chemicals and processes that are under high pressure can lead to hazardous and even deadly incidents. That’s why it’s essential for safety managers and supervisors to identify and communicate recommended safety controls and hazards that exist on each work site before work begins.
Oil & gas and utility companies have very important task when it comes to compliance, and that's not only to keep its employees safe and sound but to mitigate the risks to customers and the environment caused by safety and compliance errors that could lead to disaster. Plus maintaining safety precautions ensures the companies never have to pay heavy penalties and also reduce service cost. As oil prices rise and production increases, so do the challenges faced by EHS leaders in the oil and gas industry. How do you cut costs, optimize performance, and reduce your environmental footprint all while dealing with a high degree of regulatory uncertainty and public scrutiny
Oil and gas companies appreciate the massive amounts of oil buried deep beneath the oceans. Offshore drilling is a mechanical process carried by a rig. The type of rig and the condition of a drilled borehole at seabed are important considerations in offshore drilling. Demand for land rigs has pushed up utilization and day rates.
Drilling contractors are adding rigs through strategic acquisitions and building new programs to accommodate rising demand. By and large, a low utilization and date environment permeate the offshore rig fleet as a whole. There are isolated pockets of increasing activity and optimism, but for most rig types in most regions, recovery is not a word many rig owners use presently.
Acreage is the amount of leased real estate of a petroleum and/or natural gas company. Gross acreage is when a company shares its working interest with another company or companies. Net acreage is calculated by multiplying the company's percentage interest by the gross acreage. If a company holds the entire working interest, its net acreage and gross acreage will be the same.
Oil and Gas Operational Insights are characterized by few KPI’s, such as revenue, volume, cost, and CAPEX.
Oil and Gas Revenue typically refers to a company's revenue net of discounts and returns. However, the user refers to net profit, which is a sales net of all expenses. The generation of revenue is an important driver that influences the oil and gas industry. The operating cost of a refinery is significant. They adversely impact offshore operations.
Planned Volume is a step-by-step plan of an oil and gas company for utilizing its available capital and other assets to meet its goals for increased production volume, based on a reasonable financial forecast. A financial plan is synonymous with a business plan. It lays out what a company plans to do to use resources to generate maximum possible revenues.
Planned costs are the costs required to plan a well property is insignificant in comparison to the actual drilling costs. In many cases, Spending less than $1,000 for $1 million well represents one-tenth of the well's costs.
Oil and Gas Capital Expenditure or CAPEX is financing used by companies to secure physical assets or upgrade current assets. CAPEX generally takes two forms:
Revenue analysis, P&L analysis, and cash flow analysis characterize oil and finance management. Revenue analysis provides insights into COGS and OPEX. Cost of Goods Sold refers to the production of the goods sold in a company, including the cost of the material to create the goods as well and the direct labor costs to produce them. Considerations in the analysis include sales force and distribution costs.
Cost of Goods Sold is the direct costs attributable to the production of the goods sold in a company. This amount include: 1. The cost of the materials 2. The direct labor costs used to produce the goods It excludes indirect expenses, such as:
Barrels of oil equivalent measure:
Allowing for the comparison of unit prices and costs gross margin is revenue minus cost of goods sold (COGS) divided by revenue or per-BOE values.
P&L Analysis is composed of Gross Sales Growth Rate, Selling Expenses, etc. “Gross Sales Growth Rate” is the percentage change of Gross Sales within a specific time and given a certain context. For investors, growth rates typically represent the compounded annualized rate of growth of a company's revenues, earnings, dividends or even macro concepts, such as gross domestic product (GDP) and sales. Expected forward-looking or trailing gross sales growth rates are two common kinds of growth rates used for analysis. At their most basic level, Gross Sales growth rates express the annual change in sales growth as a percentage.
Selling Expense is a cost to promote and market products to customers. These costs include anything from advertising campaigns and store displays to delivering goods to customers. A selling expense is any expense associated with selling a good or making a sale. Since investors and creditors focus on costs related to producing income, they emphasize selling before administrative expenses because they are concerned about costs. Although general and administrative expenses are important, they do not produce sales.
Cash Flow Analysis provides insights into cash flow, income, and expense, etc.
Cash flow is the net amount of cash and cash equivalents transferred into and out of a company.
Positive cash flow indicates an increase in a company's liquid assets. It can reinvest in its business and return money to shareholders and pay expenses. The cash flow statement records cash flow, containing three sections detailing activities. Those three sections are cash flow from operating activities, investing activities, and financing activities. Income is money that an individual or business receives in exchange for providing a good or service. Or, it could be through investing capital. Income funds day-to-day expenditures. In businesses, income refers to a company's remaining revenues after paying all expenses and taxes. In this case, income means "earnings.” Most forms of income are subject to taxation. Interest Expense is the cost incurred by an entity for borrowed funds. Interest expense is a nom operating expense shown on the income statement. It represents interest payable on any borrowing’s bonds, loans, convertible debt, or lines of credit. The product of the interest rate by the outstanding principal amount of the debt is the formula for interest expense.
Oil and Gas “Capital Expenditure, or CAPEX, is financing used by companies to secure physical assets or upgrade current assets. CAPEX generally takes two forms: 1)maintenance expenditure, in which a company purchases assets that extend the useful life of existing assets 2) Expansion expenditure, in which a company purchases new assets to grow the business.
CAPEX is capital expenditures such as drilling & completing a well. It’s a critical component to capital budgeting & should be monitored well. Capital Expenditures incurred in exploration activities should be expensed unless they meet the definition of an asset. An entity recognizes an asset when economic benefits will probably flow to the entity as a result of the expenditure.
The economic benefits might be available through commercial exploitation of hydrocarbon reserves or sales of exploration findings or further development rights. It is difficult for an entity to demonstrate the probability of exploration expenditure. Entities do not adopt IFRS 6. Instead, they develop a new policy under the framework expensed until the capitalization point.