Natural Language Processing Increases Consistent Customer Experience Across All Channels By 50%.


Our Measurable Values


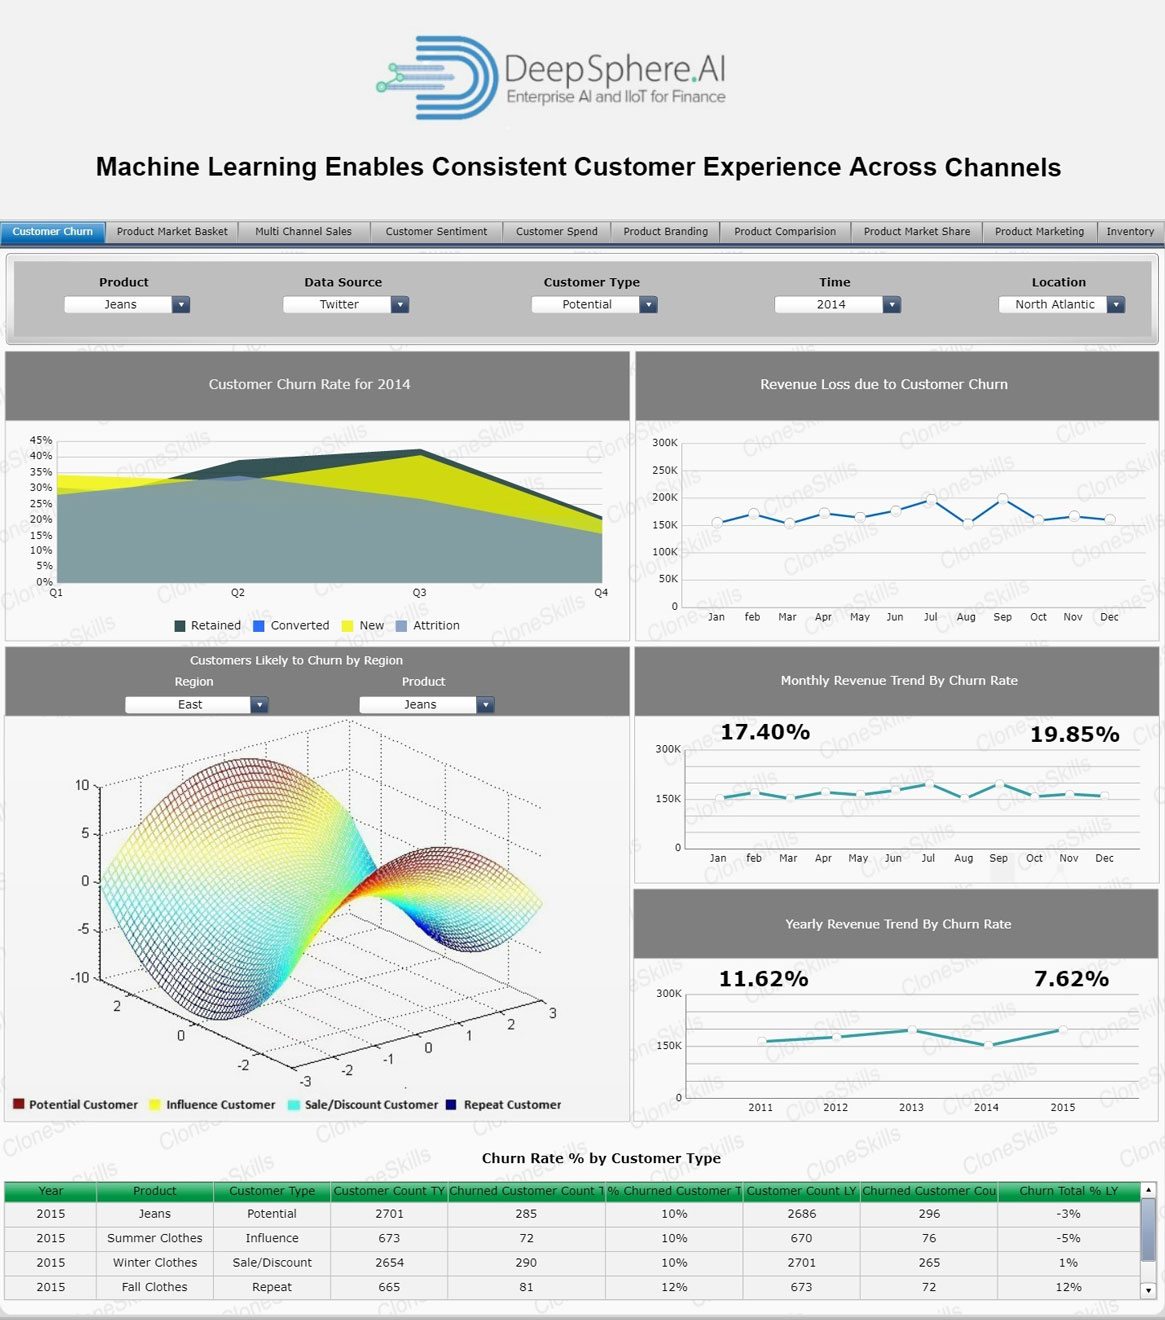
The term “Customer Churn Rate” is defined as the percentage of subscribers to a service who discontinue their subscriptions to that service within a given time period. In simple terms: Customer Churn Rate is when you lose a customer. Churn will always occur no matter how much efforts you put into satisfying your customers. There are several reasons why customers will stop doing business with you which you can’t control. However, when the churn rate is high, it can affect businesses decision-making processes, as well as their revenue.
Customer Churn Rate is a critical KPI for businesses because (1) the cost of retaining a current customer is almost always less than attaining a new one, and (2) for businesses with recurring revenue models, keeping a customer can be worth hundreds and even thousands of dollars in future revenue. Companies concerned with customer churn often distinguish between gross versus net Customer Churn Rate. Gross Customer Churn Rate is the rate at which a company is losing customers, while Net Customer Churn is a measure of the difference between Gross Customer Churn Rate and New Customer Acquisition Rate.
Due to the importance of keeping Customer Churn Rates down, subscription based companies often have departments dedicated to engaging and improving relations with unsatisfied customers, or winning back lost customers.
The term “Revenue Churn” is defined as is a metric for loss of revenue. It's a typically used in the businesses with subscription-based models, and will have varying definitions based on who you're talking to. It is typically reported in relation to MRR (Monthly Recurring Revenue), but occasionally for companies using a longer sales cycles, might be reported on annual basis.
Revenue Churn can be reported in aggregate, but is often reported in categories or buckets, for example:
Revenue Churn is a huge indicator of growth potential. That’s because, even when companies have significant customer churn, they can overcome it with expansion revenue. (This assumes that they are netting more total customers month over month. If not, they have bigger troubles.) Ideally, the expansion axis aligns with customer usage (another carefully examined diligence topic/health indicator). What you want is for successful customers to naturally scale in both usage and MRR. When you have that, combined with success in new customer acquisition, you have a growth machine that will be hard to slow down. It’s a recipe for success.
The term “Potential Customers” is someone who is capable of becoming a purchaser of product and/or services from an organisation. By understanding your Potential Customers, those most likely to buy from your organisation, you can target your Communication Material accordingly. The key group of Potential Customers, is known as your Target Audience, the group of people or organisations who are most likely to buy from your company.
Every company or an organization should be intensely focused on their prospective customers. The ability to find a customer, sell your product or service to that customer, and satisfy the customer so that he buys from you again should be the central focus of all entrepreneurial activity. The greater clarity you have with regard to your ideal customer, the more focused and effective your marketing efforts will be. Everyone is in the business of customer satisfaction in some way. The most important activity of any entrepreneur is to clearly identify the very best customers for your product or service, and then focus all marketing, advertising and sales efforts on this particular type of customer.
Your ability to clearly define and determine the very best customer for your product or service will determine your success in business. How could you find more perfect customers for your product? How could you create new customers for your product? Define your unique selling proposition and communicate this key benefit in every customer contact.
“Impulsive Customers” are customers who buy goods and services without planning in advance. When a customer takes such buying decisions at the spur of the moment, it is usually triggered by emotions and feelings. Impulsive buying can't be categorized for one specific product category. Impulsive buying can be seen in products such as chocolates, clothes, mobile phones and in big-ticket items such as cars, jewellery etc. Impulsive buying means making an unplanned purchase. It is based on an irrational thinking.
These customers are difficult to convince as they want to do the business in urge or caprice. They don’t have any specific item into their product list but urge to buy what they find good and productive at that point of time. Handling these customers is a challenge as they are not particularly looking for a product and want the supplier to display all the useful products they have in their tally in front of them so that they can buy what they like from that display. If impulsive customers are treated accordingly then there is high probability that these customers could be a responsible for high percentage of selling.
Marketers try to tap this behavior of customers to boost sales. There is a great likelihood that customers end up making a purchase of products after entering the hypermarket without any actual intent of doing so. Many mobile phone-makers tend to exploit this trait in customers by introducing products which can be an add-on gadget for their mobiles such as fitness bands, watch etc.
The term “Discount Customer” are customer who shop frequently but bases buying decision primarily on markdowns. Discount customers play an important role in turning a company’s inventory over. Therefore, discount customers are a key contributor to a company’s cash flow. This type of customers seldom purchases products at full price and shops around for the best markdowns. Discount customers are resilient to upselling, are usually the least loyal segment of customers, and generally moves on when better markdowns are available.
Discount customers are also frequent visitors but they are only a part of business when offered with discounts on regular products and brands or they buy only low cost products. More is the discount the more they tend towards buying. These customers are mostly related to small industries or the industries that focus on low or marginal investments on products. Focus on these types of customers is also important as they also promote distinguished part of profit into business.
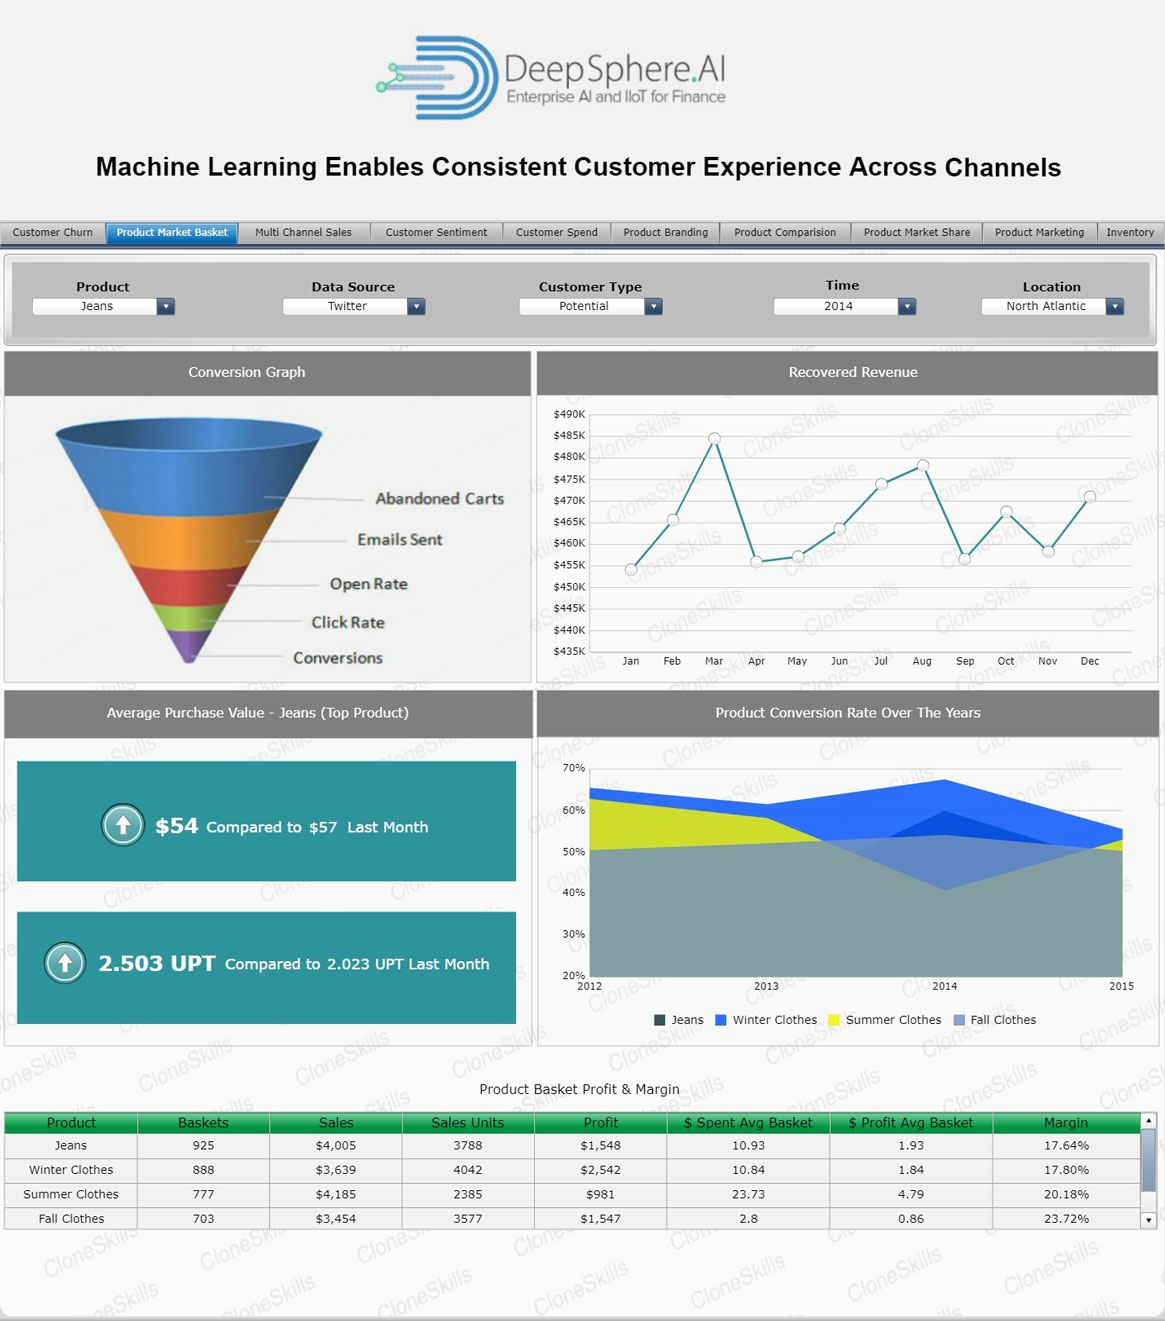
The term “Recovered Revenue” is defined as a strategy to predict and then protect or recover lost or at-risk revenue, focusing on both abandoned purchase intentions across the buying cycle, and defecting customers within the lifecycle. With revenue recovery built into an ecommerce strategy, marketers can glean more revenue from website visitors and existing customers.
Traditional forms of revenue recovery such as automated abandoned shopping cart emails are common practice. Additionally, many companies run dedicated re-engagement email campaigns to target customers who have become inactive. This is revenue recovery in its simplest form. Attracting new customers has long been seen as the key ecommerce business objective. In markets where there is steep growth in new customers, an acquisition-only strategy even one demanding expensive incentives can be very successful.
However, customers buying only once cannot be either a sustainable or profitable long-term business model. It typically costs seven times more to acquire a new customer than sell to an existing one in ecommerce, so a first-time purchase is rarely profitable. There is an enormous necessity for revenue recovery strategies to target all types of website visitor, whether they are visiting for the first time, returning or are customer with intent to purchase.
Abandonment is an ecommerce term used to describe a visitor on a web page who leaves that page before completing the desired action. Examples of abandonment include shopping cart abandonment, referring to visitors who add items to their online shopping cart, but exit without completing the purchase. Cart, or basket, abandonment may be the most obvious, but there are several types of abandonment across different sectors.
Cart abandonment rates vary by sector, as sites have very different purchase processes and customer behavior. For example, fashion purchases are often faster and easier (and relatively low-price) so customers don’t take so much time to make a decision. Hence lower abandonment rates. As the online experience becomes more complex and the typical research phase longer, then we begin to see higher abandonment rates.
However, even if the purchase process is a little longer, sites can still reduce abandonment rates by making sure that the site is well optimized and easy to use. Cart abandonment is a rising challenge for all retail marketers. This is a shocking revelation, especially with the constant rise rise across the year in 2016, the number was at 74.5%, and 75.5% in 2017. This is why marketers usually turn towards emails to help recover these abandoned sales. And there’s a really good reason for that: 46.1% of people open cart abandonment emails, 13.3% click inside the email, and of those clicks, more than 35% end up buying something.
The term Email “Open Rate” is a measure which indicates a percentage of opened emails for a certain email marketing campaign. Email open rate usually shows how well you were able to catch subscriber’s attention with the subject line or whether your emails reached the inbox or went to the spam folder. Email open rate is one of the indicators to monitor email marketing campaign’s success. It helps to understand which aspect of email strategy requires improvement.
If an email open rate is low, it’s a wake-up call. Imagine an email marketing campaign as a funnel. Obviously, the last and the most desired action in email marketing (usually it’s a click-through) won’t be taken by the recipients unless they open the email and then read it to the end. Despite its own importance, email open rate is most useful in combination with other measures of email marketing success like click-through rate, the number of unsubscribers, spam complaints, and forwarded emails. This set of metrics provides a holistic view of how effective a certain email marketing campaign is.
If your email open rate is unusually low, you may have failed to catch subscriber’s attention with your subject line or haven’t defined the right time for your email.
The term “Conversions” is defined as the point at which a recipient of a marketing message performs a desired action.” In other words, conversion is simply getting someone to respond to your call-to-action. Getting someone to open an email is a conversion. Having them click on the call-to-action link inside that email is another conversion. Going to the landing page and filling out a registration form to read your content is a conversion. And, of course, buying your product is the ultimate conversion.
For consumer marketers, conversion can be relatively fast and simple. A possible customer scans a QR code to get a coupon (that’s a conversion right there), and then they immediately go to the restaurant to get their free French fries with a burger and soft drink purchase. In the longer and more complex B2B sale, you want a steady series of small conversions. Engage with your lead nurturing email sends, engage on the website, interact with your social media efforts, and hopefully do a lot of these activities on a mobile device.
The term “Average Purchase Value” measures the average value of each purchase made by the customers and will often compare that to the average number of units per transaction. Purchase Value may vary greatly depending on the type of products and services you are selling. Purchase Value measures the average sales value of each sales transaction you process. By understanding consumer purchasing behaviors one can develop strategies to strengthen certain tendencies such as incentivizing consumers to purchase higher end product.
Average purchase value is expressed as a dollar value. If you sold ten units for total revenue of $25,000, your average purchase value would be $2500. This KPI is often analyzed in conjunction with supply chain KPIs like units per transaction to understand how to meet consumer demand. Purchase Value is more focused on understanding changes in value at first purchase point. This enables you to understand whether your sales and marketing activities are driving higher or lower value customers into your customer base.
Average purchase value is a useful KPI to consider when developing a sales growth strategy. A common strategy is to increase the value of each sales transaction either by upselling clients or selling more expensive goods. If your average order value increases, and you keep the same number of customers, you will see an increase in sales revenue.
The term “Product Conversion Rate” is defined as the ratio of quantity to # of visits for different product as a Product Conversion Rate. Product Conversion Rate is very important to understand which product is converting better vs. others? Moreover if you have cost data, you can also find out that whether the profitable products are converting better or not? With such insights, you can modify the e-commerce shop to ensure that the profitable products get more chance to convert etc.
Measuring and reporting conversion rates is vital for all ecommerce marketers. Benchmarking your conversion rate against others in the same industry can give you an indication of how you compare to your competitors. However, having a lower conversion rate does not mean your marketing has been unsuccessful, it shows that there's room for improvement.
Improving customer journey effectiveness is important for any conversion rate optimization (CRO) strategy. To reach and surpass your competition businesses think about the techniques to use to research and improve customer journeys.
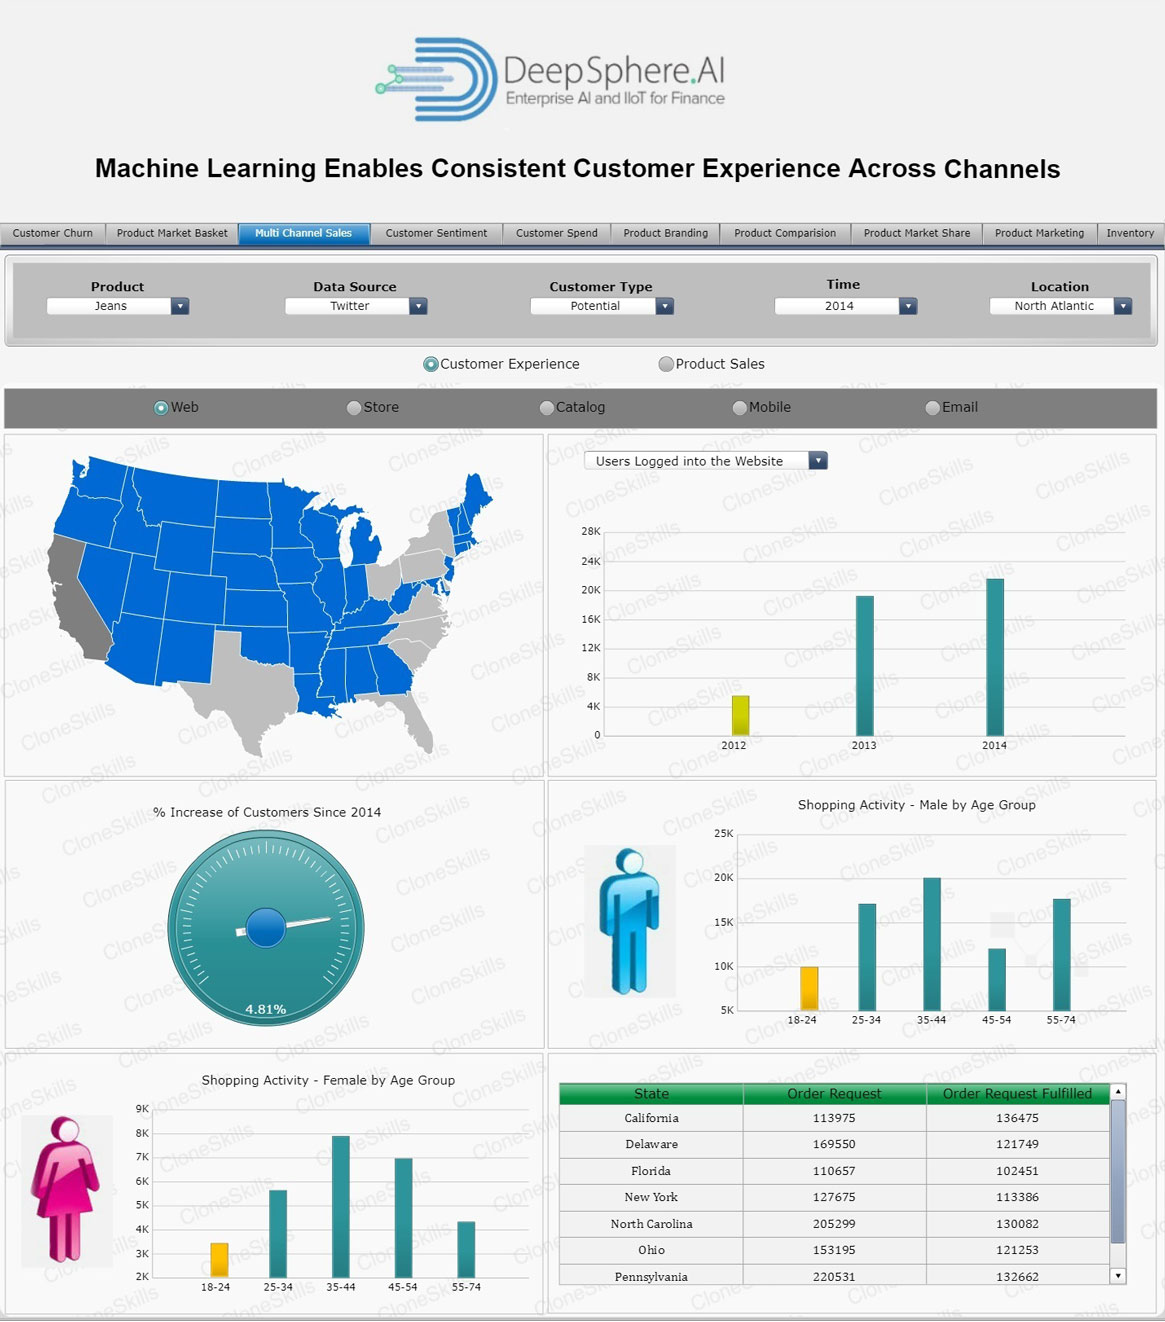
The term “Shopping Activity” is defined as an activity in which a customer browses the available goods or services presented by one or more retailers with the potential intent to purchase a suitable selection of them. A typology of shopper types has been developed by scholars which identifies one group of shoppers as recreational shoppers, that is, those who enjoy shopping and view it as a leisure activity.
Online shopping has become a major disruptor in the retail industry. Consumers can now search for product information and place product orders across different regions while online retailers deliver their products directly to the consumers home, offices or wherever they want. The B2C (business to consumer) process has made it easy for consumers to select any product online from a retailer's website and to have it delivered relatively quickly. Using online shopping methods, consumers do not need to consume energy by physically visiting physical stores, but save time and the cost of travelling. A retailer or a shop is a business that presents a selection of goods and offers to trade or sell them to customers for money or other goods.
Shoppers' shopping experiences may vary, based on a variety of factors including how the customer is treated, convenience, the type of goods being purchased, and mood.
The term “Order Request” is defined as a request sent internally within a company or a store to obtain purchased goods and services, including stock. The request is a document which tells the purchasing department or manager exactly what items and services are requested, the quantity, source and associated costs. Order Request is a very important tool for an effective marketing strategic planning. It creates an image of the company’s products in the mind of consumers, highlighting the most important benefits that differentiate the product from similar products in the market.
Order Request involves identifying points of parity and points of differentiation that enable a company’s product to both meet market standards while offering consumers additional value on key dimensions such as quality, innovation, price, leadership, and functionality, among others. Marketers must keep an eye on the competition while considering positioning elements of their marketing strategy. An effective positioning must convey a message to customers why this company’s product should be preferred over the other competitor’s products of similar nature. In other words, the company should not go by the flow of the market i.e. copying what the competitors are doing rather they need to stand out from the crowd by offering distinguishing or differentiated product attributes and other value added services.
The term “Customer Visits” is defined as footfall of people who go into a shop or a store in a particular period of time for purchases. Customer Store Visit is the bread and butter for any store manager – intrinsically linked to driving sales in retail and improving conversion rates, the more people that come into your store, the more chance they will buy something.
Customer Visit is one of the most essential measures when it comes to running a brick-and-mortar store. More traffic means more opportunities for sales and customer engagement, which in turn leads to higher revenues. There are two key elements to why Customer Store Visit is so important: what it tells you, and what it means in terms of conversions. First, Customer Store Visit tells you how successful your marketing strategy is, in terms of drawing prospective customers’ attention.
A high number of people walking into your store is an indicator that your advertisements, marketing campaigns, and window displays/product placement are effectively drawing large numbers of potential customers into your store or shopping center. Conversely, a low Customer Store Visit number can indicate an unsuccessful marketing campaign. This knowledge is important, as not knowing these Customer Store Visit figures can result in revenue loss of up to 15%. The other reason that Customer Store Visit is so important is that it allows businesses to know many of these customers walk away having purchased your product.
The term “Customer Store Purchases” also called as In-store Purchases where the customer goes to a store for a purchase. The way that customers make purchasing decisions has dramatically altered: they stand in stores, using their smartphones to compare prices and product reviews; family and friends instantly weigh in on shopping decisions via social media; and when they’re ready to buy, an ever-growing list of online retailers deliver products directly to them, sometimes on the same day.
These shifts have led a number of industry observers to forecast the end of retail as we know it. Some predict that retail will change more in the next five years than it has over the past century and that the extinction of brick-and-mortar stores isn’t far off. Our view is less dramatic, but we do believe that big changes are inevitable and that retailers must act now to win in the long term.
There is historical precedent for this kind of upheaval, which recasts the industry’s winners and losers. Within the past century, local corner stores gave way to department stores and supermarkets, then to suburban shopping malls, then to discount chains and big-box retailers. Each of these shifts unfolded faster than the one that preceded it, and each elevated new companies over incumbents. Indeed, six of the ten largest US retailers in 1990 have since fallen from their positions as new winners, such as Amazon.com, Costco, and Walgreens, emerged in their place.
The term “Product Catalogue” is defined as is a detailed list of the inventory of a store. The catalog contains all the data related to the products which include product images, descriptions, specifications, price etc. The
product catalog data is viewed by customers before making a purchasing decision. Therefore, it’s important to maintain proper processes for keeping this data updated, ensuring consistency in the data, improving on its quality, making it easily accessible to potential customers regardless of the device it is being viewed on etc. This entire process is known as product catalog management.
Product Catalogues play a vital role in your marketing mix. There are many key reasons that show why catalogues are a visual and tactile experience for your customers, and a channel that you really shouldn’t ignore. When shopping with a catalogue, 52% of people bring more than planned and 75% of recipients say catalogues can give them ideas for things to do or buy. Customers have time to browse through the pages, allowing themselves to be inspired by the ideas and products.
The term “Product Orders Placed” is defined as placing an order for a product purchase & term “Product Orders Delivery” is defined as the process of transporting goods from a source location to a predefined destination. Order Placement is the most general sense the complete Order Management process from point of sales inquiry to delivery of a product to the customer. Sometimes order placement is used to describe the more narrow act of distribution or the logistics function, however, in the broader sense it refers to the way firms respond to customer orders.
The order placement to order delivery process is the principal means by which buyers or customers communicate with sellers, the final sale transaction is made, and cash is generated for the seller. The Order to delivery process is also known as the order to cash process, is an extremely important core business process in any enterprise. It is a customer-facing process and is key to operational efficiency and customer satisfaction. Can the order processing process create differentiation and competitive advantage? Most certainly yes. Companies should strive to create an order to delivery that is world class and that results in customer delight.
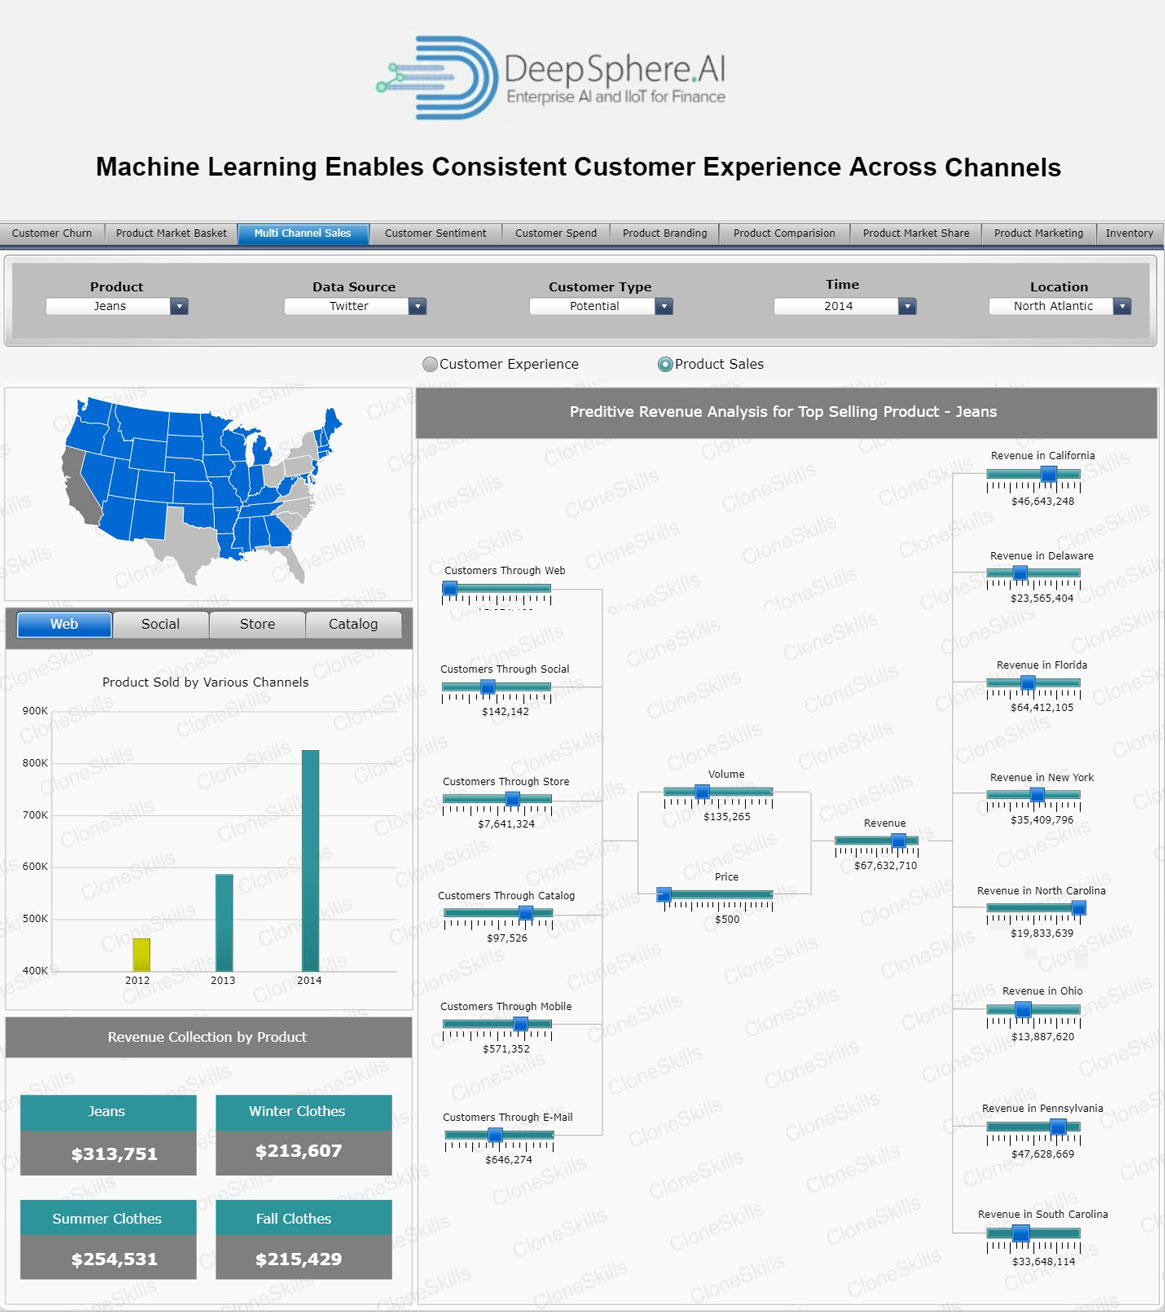
The term “Product Sales” is an act of selling a product or service in return of money or compensation or service. Product sales is when a customer buys a product / service which will fulfill a need of theirs. The number of products sold in a given time period helps in determining the product sales. Product sales is a critical parameter in understanding the business of a company.
Finding new people to buy your product or service is an important part of the entire sales process. It may be tough for some people, but if your goal is to increase sales then you need to figure out which sales strategy will be effective for your target customer. People don’t buy products, they buy the results that product will give. Company’s start the process of identifying your ideal customer by making a list of all of the benefits that your customer will enjoy by using your product or service.
The term “Product Volume” measures the total amount your company can produce over time. This KPI tracks the total number of products manufactured over a set period of time (days, weeks, months, quarters, years) and focuses on total output. Because production volume is measured over an established period of time, you can easily compare a specific point in time against a benchmark or even as part of a larger trend.
Knowing that you have a spike in product volume during a specific period every year can help you prepare in advance to avoid down time, machine failures, and resource scarcity. Similarly, it can inform you if your factory or production floor is operating as efficiently as it has in the past.
No matter what type of product you sell, the price you charge your customers or clients will have a direct effect on the success of your business. Though pricing strategies can be complex, the basic rules of pricing are straightforward. Before setting a price for your product, you have to know the costs of running your business. If the price for your product or service doesn't cover costs, your cash flow will be cumulatively negative, you'll exhaust your financial resources, and your business will ultimately fail.
One of the secrets to business success is pricing your products properly. Price your products correctly and that can enhance how much you sell, creating the foundation for a business that will prosper. Get your pricing strategy wrong and you may create problems that your business may never be able to overcome. Because pricing decisions require time and market research, the strategy of many business owners is to set prices once and "hope for the best." However, such a policy risks profits that are elusive or not as high as they could be.
There are a variety of different types of pricing strategies in business. However, there's no one surefire, formula-based approach that suits all types of products, businesses, or markets. Pricing your product usually involves considering certain key factors, including pinpointing your target customer, tracking how much competitors are charging, and understanding the relationship between quality and price. The good news is you have a great deal of flexibility in how you set your prices
The term “Product Revenue” is the total value of sales made to client and the transfer valuation of shipments including discount, allowances and refund, if any. It comprises of revenue generated from product sold or services provided to the company. It also includes installation services and leases given to other business. It excludes after sales revenue, royalties, maintenance revenue and spare part revenues.
Revenue is a very important metric to a company as it is the amount of money a company brings in or earns before any expenses are taken out. From an accounting perspective, revenue typically consists of product and service sales on account or where the customer paid in cash.
Revenues are sales or gross receipts your company generates from fees it charges for services it renders or products it sells. These revenues are classified as operating revenues, because they come from the main business your company engages in. Revenues that come from gains on sale of assets or interest earned on investments are considered non-operating revenues. Revenues are the top line on an income statement. Without revenues, your company must tap other financing sources, including loans or equity issuance, to fund its activities.
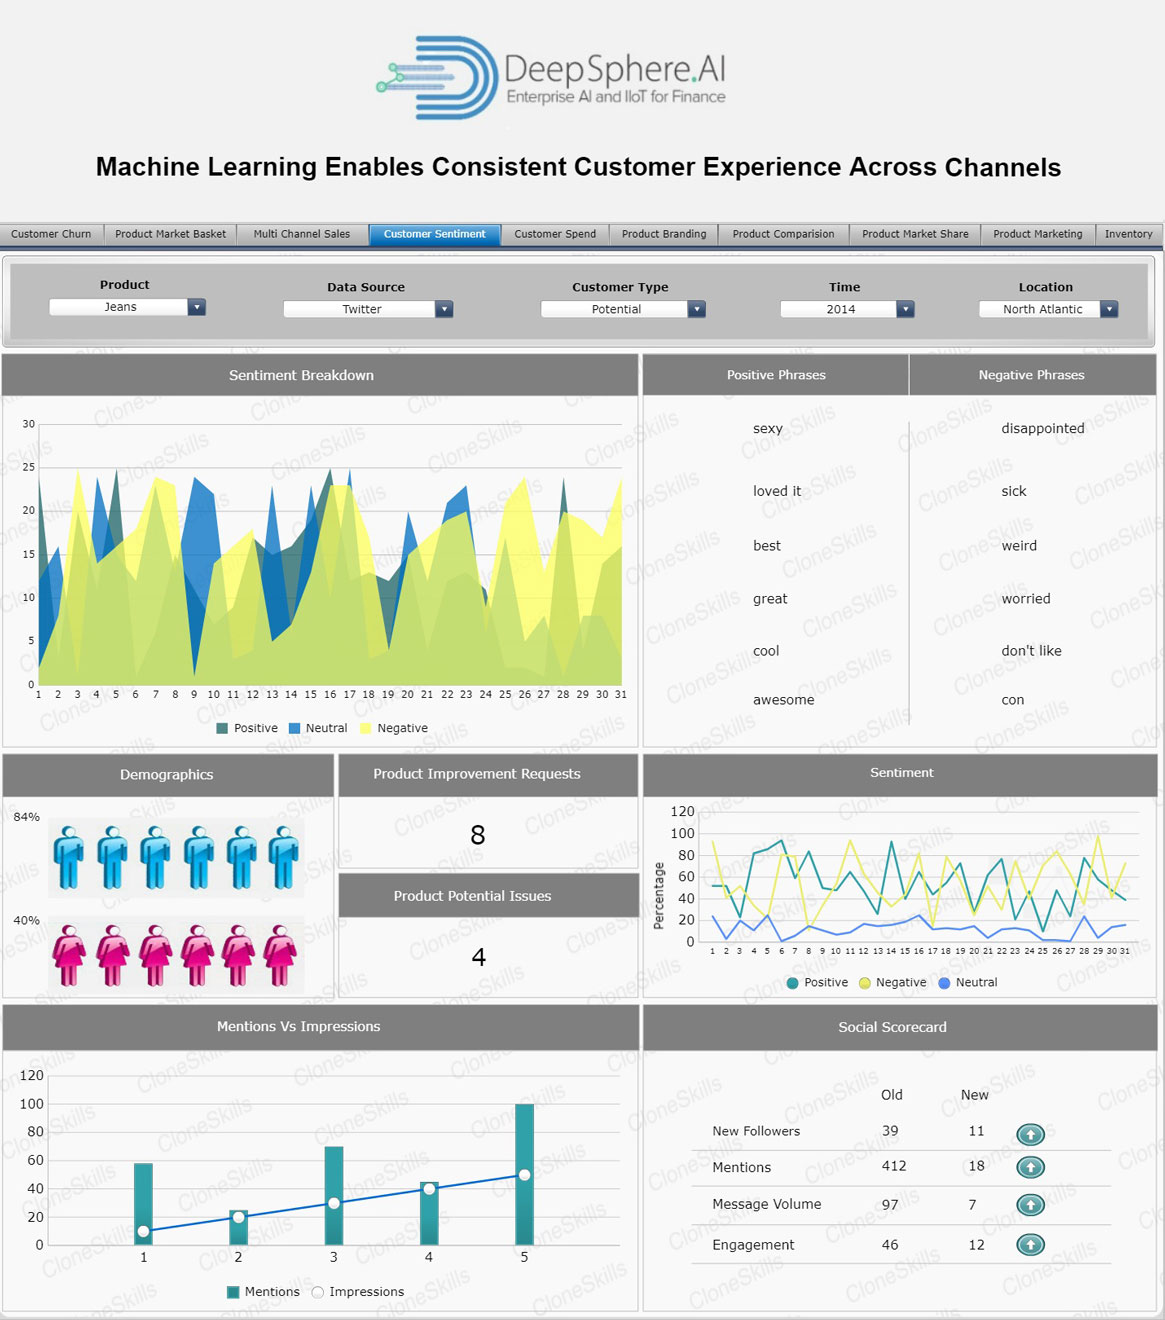
Sentiment Analysis is the automated process of understanding an opinion about a given subject from written or spoken language. Retail world generates approximately 2.5 quintillion bytes of data every day, sentiment analysis has become a key tool for making sense of that data. This has allowed companies to get key insights and automate all kind of processes. Sentiment analysis is a topic of great interest and development since it has many practical applications. Since publicly and privately available information over Internet is constantly growing, a large number of texts expressing opinions are available in review sites, forums, blogs, and social media.
“Positive, Negative or Neutral” sentiment in general means the attitude or opinion one expressed within a given post towards a specific subject. It’s based on algorithms evaluating whether the words included in a post are related to positive, negative or neutral emotions. Sentiment analysis is used by a majority of social media monitoring tools such as Social Mention (which has been shut down recently, by the way) or Brand24. It is still difficult for a vast majority of tools to precisely evaluate what truly is a negative, neutral, and a positive statement. I am not quite sure about the mechanics behind it, but at the moment it’s not advanced enough to successfully deal with sarcasm or context of some of the discussions.
Sentiment Analysis is the automated process of understanding an opinion about a given subject from written or spoken language. Retail world generates approximately 2.5 quintillion bytes of data every day, sentiment analysis has become a key tool for making sense of that data. This has allowed companies to get key insights and automate all kind of processes. Sentiment analysis is a topic of great interest and development since it has many practical applications. Since publicly and privately available information over Internet is constantly growing, a large number of texts expressing opinions are available in review sites, forums, blogs, and social media.
“Positive” Phrases are Sentences with Positive Sentiment related to agreements/disagreements. Ex: “I love this Pair of Jeans”
“Negative” Phrases are Sentences with Negative Sentiment related to agreements/disagreements. Ex: “I don’t love this Shoes”, “This Product is horrible“
“Neutral” Phrases are Sentences with Neutral Sentiment related to agreements/disagreements. Ex: “I kind of like the phone that I bought but its doesn’t all have the features that iam looking our for.“
“Product Improvement Requests” are defined as the Requests made by the customers for Improvements to be made on the product. Product Improvement Requests Improve Store Operations. Today’s marketplace is a customer-centric one, and customer experience is becoming a core discipline for organizations looking to stay ahead of the competition. Product Improvement Requests needs to be considered for a satisfactory customer experience. A local store manager or the head of an entire region, can help the organization improve store operations by adopting customer-focused practices. Considering Product Improvement Requests is one of them.
Assumptions even educated guesses leave room for error, a risk you can’t afford to take. Gain important insights directly from the Customers with an online questionnaire. Does your product meet customer needs now and in the future? Are there certain associations users make when thinking of your brand and designs? What enhancements do your users want to see, and which features can they live without? What are your buyers pricing sensitivities?
Product Improvement Requests give you the insider knowledge you need to plan new products, grow your business and succeed in today’s competitive marketplace. Whether you’re creating software, apps, or real-life widgets, using one of our product survey samples can get you on your way to being more competitive, improving your product, and creating items your customers will love.
There are numerous ways in which a product may be considered to have “Potential Issues”. Once an item enters the stream of commerce and injures someone, the victim may be able to pursue a products liability claim against the party found to be responsible. Product liability cases can often be brought against any of the parties in the manufacturing chain, including the manufacturer of parts, the manufacture who assembled the parts, the wholesaler and the owner of the retail outlet that sold the product.
Products with potential issues cause thousands of injuries throughout the country each year. That is why there are product liability laws in place, which hold manufacturers and third parties accountable for consumer injuries. These laws create rules about how defective products are handled, and how victims might receive compensation for those injuries.
Product liability is a term that refers to a manufacturer, distributor, or retailer being held accountable for allowing defective products to reach the consumer level. The responsibility for these defects applies to all sellers. Therefore, the primary retailer, manufacturer, and even the distributor or wholesaler might be named in your lawsuit.
The term “Mentions” is defined as the text inclusion of a monitored keyword in a post on a social media platform like Twitter, Facebook, a blog, mainstream news with an RSS feed, a forum/board, YouTube or Pinterest. Mentions are online acts of self-expression in which individuals, organizations and other entities invest (at least) a small amount of social capital. The term “Impressions” is defined as a metric that helps in measuring the number of people who have seen a post, even if they didn’t click, comment, or otherwise engage with that post. They are a particularly important metric on Twitter, Facebook, Instagram, and LinkedIn.
Mentions have more in common with the metric of media hits than they do with the more common, older PR and marketing metric of impressions. Mentions are a better leading indicator of willingness to take action for the oceans than other communications metrics. This is because mentions represent actions, the choice of an individual to risk a small amount of social capital by associating their online identity with a piece of online content. In aggregate, the volume of mentions not only represents the amount of attention being paid to a topic, but a forecast of potential campaign success. For this reason, generating mentions is the primary goal of our attention campaigns.
Impressions can be extremely important metric for businesses who rely heavily on brand awareness and promotions. While a lot of “likes” and “comment” are appreciated, impressions can truly determine how many people are actually seeing your content. The major difference between a reach and an impression is that impressions measure how many total number of times the content is actually being seen by the audience, whereas reach is the number of people actually seeing the content.
“Message Volume” Trends Across Private and Public Channels. Customer Care through private messaging channels is beneficial to both businesses and customers. For businesses, the asynchronous nature of messaging gives customer care teams more flexibility in allocating resources and setting priorities, especially with the right kind of tools. In addition, messages through private channels contain much less ‘noise’ when compared to their public counterparts, such as Twitter handles for instance, which tend to be bombarded with all sorts of content - most of which is irrelevant to the interests of customer care teams.
Though, many software solutions do exist that provide tools to combat such spam, it takes significant effort to maintain a level of satisfactory accuracy, as the vocabulary of languages used on social media is constantly evolving. Moreover, private messaging opens up the opportunity for bots and agents to work together seamlessly, with bots taking care of the tedious parts of data collection and organization, and agents being free to focus on engaging with the customers and providing issue resolution.
From a customer’s perspective, private messaging is simpler, more intuitive, and more flexible than public. Not to mention, messaging apps today are practically ubiquitous and incredibly easy to access. As a result, today’s consumers always prefer the easiest and quickest means of issue resolution. This is also why we predict that in the digital customer service care arena, people will continue to move away from using public channels like Twitter and Facebook public pages,.
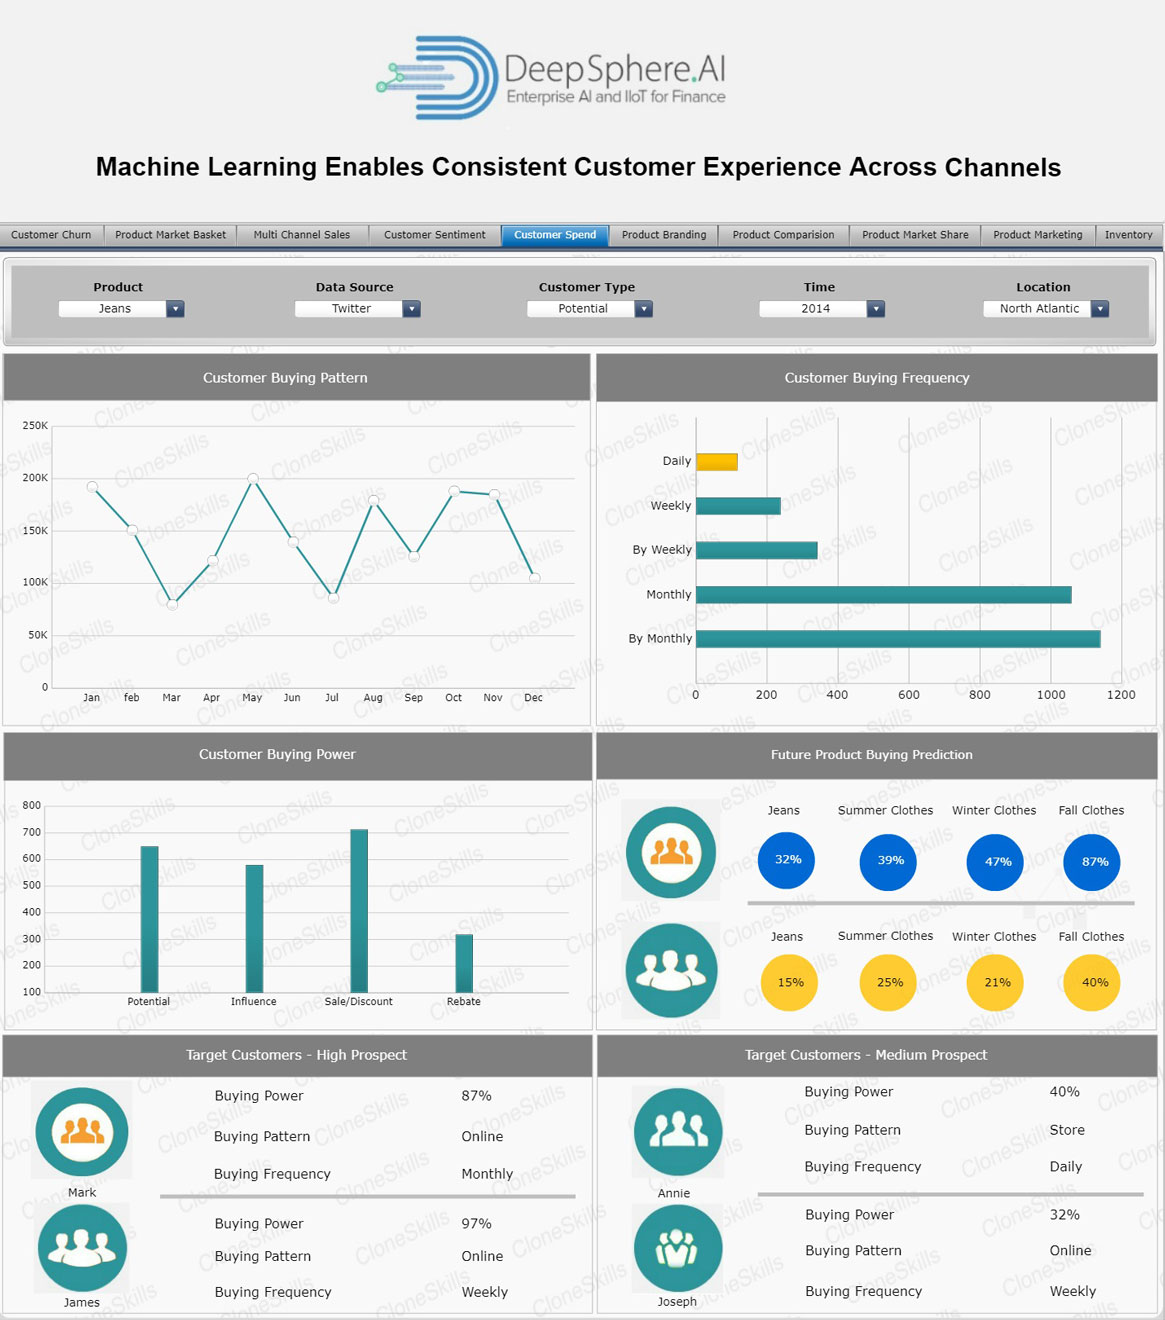
The term “Customer Buying Pattern” is defined as the typical way in which Customers buy goods or avail services- encompassing frequency, quantity, duration, timing etc. In simple words, Customer buying patterns indicate how customers purchase goods or services but are highly susceptible to change. Marketers often try to understand buying pattern and its relation with geographical, demographic and psychological characteristics of the customer. In order to understand the buying patterns, marketers conduct comprehensive surveys.
This along with demographic and psychological information including age, gender, occupation, household income, household size, education level, geographic location, hobbies, interests etc. could provide valuable insights. Understanding the Customer buying pattern allows the company to decide on strategies for market segmentation, distribution and sales promotions. A lot of times it is nearly impossible to identify the actual customer or the real decision maker who will be going ahead with the purchase of a product/service. Hence, all who enter the retail store are considered as the customers. An understanding of the composition or the origin of the actual customers will help in the analysis of the customer’s buying behavior in a much better manner.
A customer’s buying behavior is largely governed by the needs, preferences, and tastes of the customers for whom the product/service is ultimately purchased. Numerous patterns influence the buying behavior of the customers.
The term “Customer Buying Frequency” is defined as a metric that measures the amount of times a user makes a purchase within a set time period. It is an integral part of the trilogy called Recency, Frequency, Monetary (RFM) analysis that is used to predict customer response in direct marketing promotions. Customer Buying Frequency is often a powerful predictor of response, but it is seldom as powerful as Recency. We can easily illustrate the differences by comparing the response rates of the same group of people based on their recency and their frequency.
The exact nature and extent of Customer Buying Frequency is as clear as it could be: making customers habitually come back and use your product or service with a frequency greater than chance, and of course, increase your sales. An elevated purchase frequency is responsible both for raising revenue and increasing customer lifetime value. Buying Frequency is calculated by dividing the store’s total number of processed purchase orders by the number of unique customers. Buying Frequency and repeat purchase rate help you understand and stick to what your customers really want. This data gives you an invaluable insight into what value your most profitable customers are looking for their money.
As a small business one needs to build an ongoing relationship with their customers and show that they care, thus raising brand awareness with their target audience, and the time that they spend researching their customers and users, will pay off handsomely.
The term “Customer Buying Power” is defined as the capacity of an individual customer or a specific market to buy certain quantities of goods and services. In general, high customer buying power means customers have high incomes and purchasing power relative to the supply and prices of goods available. Low customer buying power means customers generally don't have enough money to purchase goods at current market prices.
A small business needs to understand the buying power of customers in its target market groups. When you first go after a market, you want to ensure that customers can pay for your goods and services at price points that earn you a profit. You also need to consider the buying power of current markets in establishing prices and buying inventory. You must have enough inventory to meet demand at profitable price points but not so much product that you can't sell through it given the buying power of the market.
Customers buying power does not remain static year after year. Changes in the value of the currency, inflation of product prices and average wages all factor into the buying power figures. Higher prices might mean that buying power shifts to necessities such as clothing and housing and away from entertainment. Conversely, if it is found that average wages are increasing and the prices are remaining low, then buying power can shift toward industries that fulfill the wants of customers as well as their needs. Customer buying power should not be confused with Customer purchasing power. Purchasing power dictates how much of a good can be purchased with a specific amount of money.
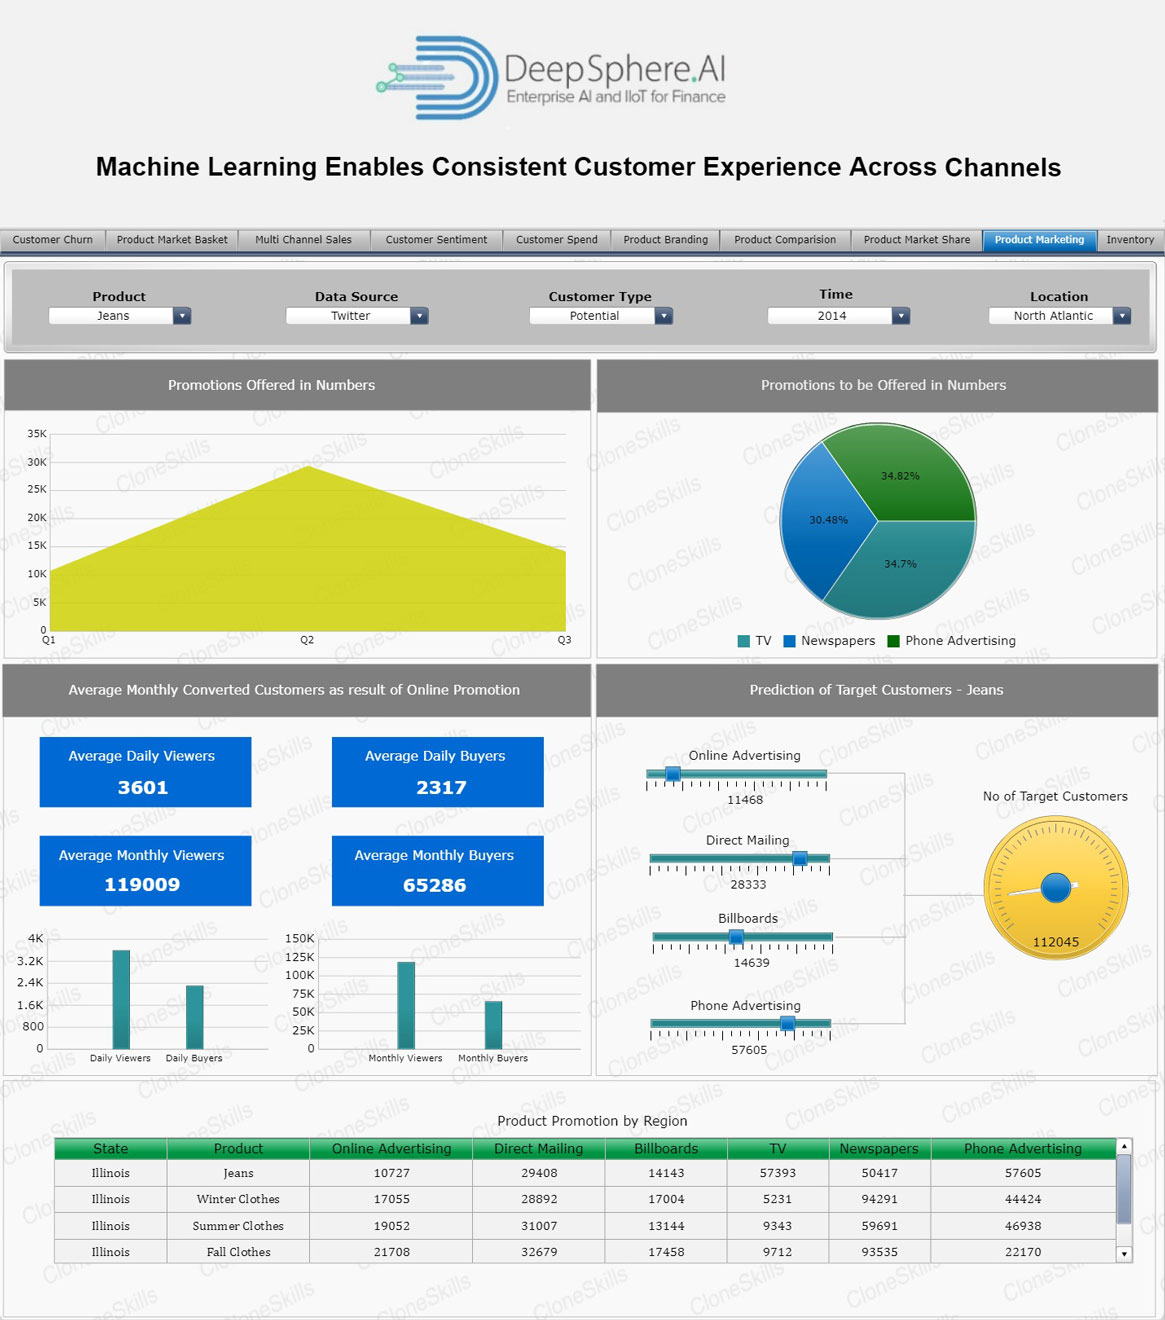
The term “Target Customers” better known as a target market, is a group of customers that a firm plans to reach with marketing efforts. Target customers may be identified for a business, brand, product, location, sales or marketing strategy. It is also defined as the specific group of customers who are the focus of a company's advertisements. This focus is communicated through media and the use of television, movies, audio, and print capabilities. The target consumer is similar to target market; however, the notable difference is the target consumer is a specific group within the target market.
Target customers have a large impact on a company's marketing and advertising plans. When companies design campaigns with messages to be conveyed in advertisements, they compose them specifically around the target consumer attributes. It is important to understand your target consumer. The better you understand your target customers, the more closely you’ll be able to focus your ads, so you can pay only to reach the audience most likely to convert into customers. As your depth of audience insight grows, you’ll start to see higher conversion rates and better ROI key metrics that matter to all marketers.
You can’t target everyone, but you can sell to everyone. Your target market should be based on audience research, not a gut feeling. You need to be willing to learn as you go, adapt on the fly, and go after the people who really want to buy from you, even if they’re not the customers you originally set out to reach.
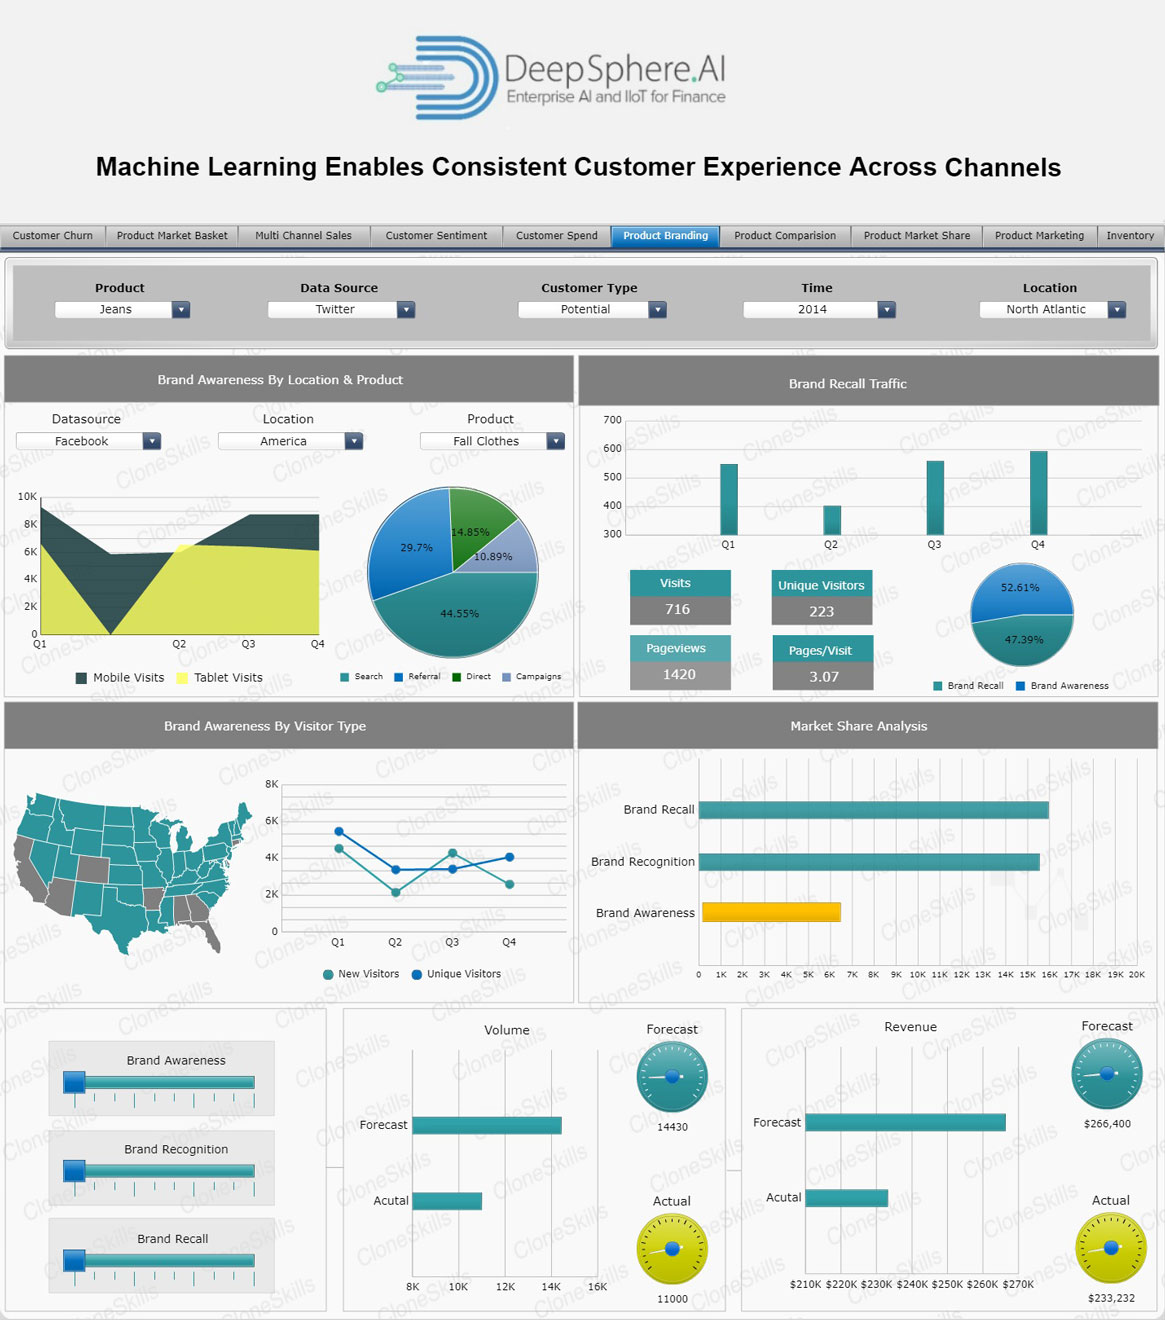
The term “Brand Awareness” is defined as a marketing term that describes the degree of customer recognition of a product by its name. Creating brand awareness is a key step in promoting a new product or reviving an older brand. Ideally, awareness of the brand may include the qualities that distinguish the product from its competition. Products and services that maintain a high level of brand awareness are likely to generate more sales. Customers confronted with choices are simply more likely to buy a name brand product than an unfamiliar one.
Consider the soft drink industry. Removed from their packaging, many soft drinks are indistinguishable. The giants in the industry, Coca-Cola and Pepsi, rely on brand awareness to make their brands the ones consumers reach for. Over the years, these companies have employed advertising and marketing strategies that have increased brand awareness among consumers, and that has directly translated into higher sales. This higher rate of brand awareness for dominant brands in a category can serve as an economic moat that prevents competitors from gaining additional market share.
As of 2019, internet users spent approximately 43 minutes per day on Facebook, 28 minutes on Snapchat, and 27 minutes on Instagram. Not surprisingly, companies are now spending a great deal of energy promoting brand awareness on these platforms. This has led to new forms of promotion in which consumers themselves generate discussions about products and services that they like and use.
The term “Brand Recall Traffic” is a great indicator of brand strength. Marketers should consider its use as a KPI. How a brand drives its traffic in the online arena is one of the most important things for any digital marketer to know. it is worth mentioning that a lot of the recall value of a brand cannot be connected with the direct traffic metric as a lot of people usually search for a brand name via search engines as well. For example, even if one is fully aware of what Yelp is or offers, people will still search for it via Search engines rather than directly visiting the website.
This is primarily because they may want precise results of restaurants without having to go through the hassle of searching once they are on Yelp (in this case). This kind of a situation is excluded from the scope of this article as this defines consumer behavior towards a brand which is a whole new topic all together. A strong brand which is not able to drive traffic to its website via its own brand name is a problem worth mentioning however it is a moot discussion in this case as this article considers direct traffic to be a very good indicator of brand recall and awareness.
During the journey of a brand from inception to maturity, the graph will shift from high paid search traffic, to organic traffic and subsequently to high direct traffic. The high direct traffic goal hasn’t been achieved by many brands because of the simple fact that consumer behavior online dictates that most people usually “Google” things even if they already know about them
The term “Brand Recognition” is the extent to which a customer can correctly identify a particular product or service just by viewing the product or service's logo, tag line, packaging or advertising campaign. Brand recognition can also be triggered via an audio cue, such as a jingle or theme song associated with a brand. Brand recognition requires the consumer to recall prior knowledge. To build brand recognition, an organization must repeatedly provide consumers with a consistent visual or auditory learning experience. Consider the case of television advertising.
A brand who spends millions of dollars on a single television commercial during the Super Bowl may be forgotten weeks after the game. However, a brand which uses a Super Bowl commercial to reinforce a years-long advertising campaign will have higher brand recognition. Brand recognition is developed by reach, frequency and consistency. A useful tactic in advertising is for a brand to develop a campaign around a concept or a character.
Brand recognition can be contrasted with brand awareness, which means the consumer knows that a particular brand exists. Brand recognition has several advantages over brand awareness, including consumer preference, loyalty and, in some cases, trust. Brand recognition can stem from positive or negative associations. To gain confidence and advocacy from consumers, brand recognition should be combined with brand equity. Brand recognition associated with negative opinions or feelings can serve the opposite: decreased preference, adoption and loyalty.
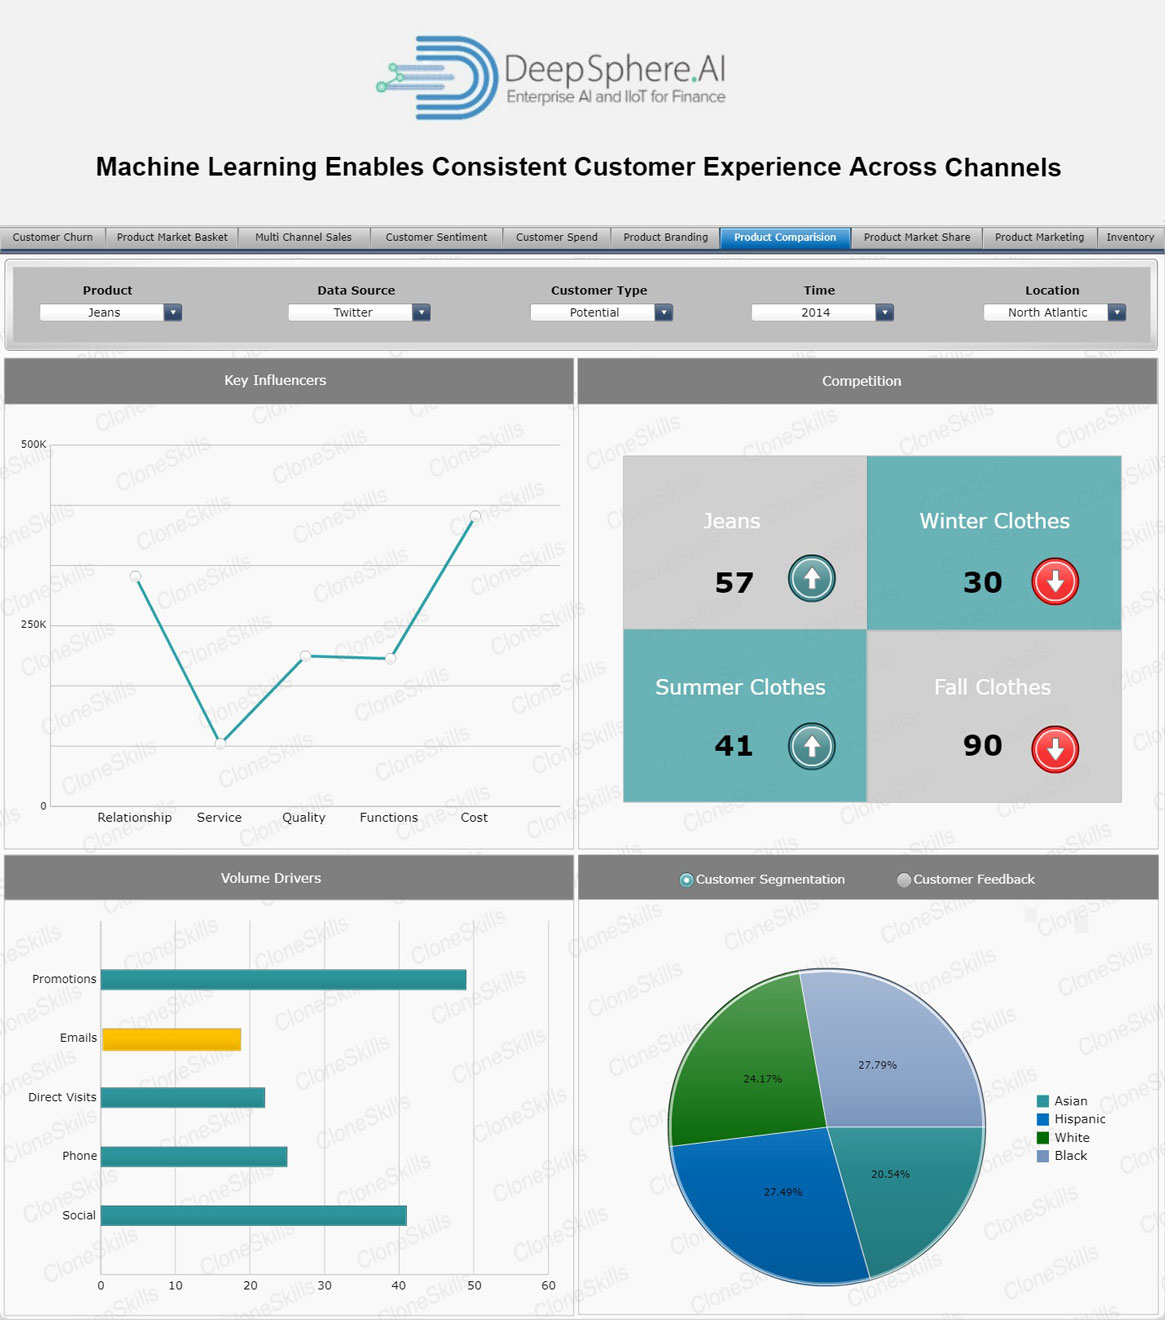
The term “Key Influencers”are people, personalities, or businesses that already have the attention of your target audience. Key influencers are the people who can actually drive sales and awareness. It's the size of their potential impact that makes them key influencers and it's their access to your target market that makes them key to your success.
Once you know who your key influencers are, you need to get familiar with their work. This takes more time. It will be time well-invested. It’s a no-brainer; Key influencers generate sales, and that’s why so many brands are jumping on the influencer marketing bandwagon. From the minute an influencer talks about your product or service, sales generation starts. Depending on the influencer’s channel and the length of the campaign, sales will be generated immediately, in bursts or over a number of weeks. Key Influencers are the link between a brand and its market awareness, it’s that simple! While influencers do generate leads and sales as well, the brand awareness they build is unrivalled in traditional PR strategies. Exposure and brand awareness is so important in today’s saturated retail and eCommerce space, so the more brand awareness you can achieve, the better.
Customers are more likely to trust the opinion of their peers than the brand itself, so partnering with an influencer to communicate your brand message is has success written all over it. Step aside traditional branded advertising; the trusted voice of the influencer is now in vogue.
The term “Customer Segmentation”is the process of dividing customers into groups based on common characteristics so companies can market to each group effectively and appropriately. Customer Segmentation allows marketers to better tailor their marketing efforts to various audience subsets. Those efforts can relate to both communications and product development.
Customer segmentation requires a company to gather specific information data about customers and analyze it to identify patterns that can be used to create segments. Some of that can be gathered from purchasing information job title, geography, products purchased, for example. Some of it might be gleaned from how the customer entered your system. An online marketer working from an opt-in email list might segment marketing messages according to the opt-in offer that attracted the customer, for example. Other information, however, including consumer demographics such as age and marital status, will need to be acquired in other ways.
Customer segmentation can be practiced by all businesses regardless of size or industry and whether they sell online or in person. It begins with gathering and analyzing data and ends with acting on the information gathered in a way that is appropriate and effective. Common characteristics in customer segments can guide how a company markets to individual segments and what products or services it promotes to them.
The term “Customer Feedback”is the information provided by clients about whether they are satisfied or dissatisfied with a product or service and about general experience they had with a company. Their opinion is a resource for improving customer experience and adjusting your actions to their needs. This information can be collected with different kinds of surveys (prompted feedback), but you can also find opinions and reviews your clients post online (unprompted feedback) and collect them using Internet monitoring tools. Both sources are important to get a full picture of how your clients perceive your brand.
Top performing companies understand an important role that customer feedback plays in business. They consistently listen to the voice of their clients. Not only they search for opinions they clients publish on social media and reviews they provide on websites designed for gathering feedback, but they also deliberately ask for feedback using distinct kinds of surveys. If you want to stay ahead of competition you should never stop listening to customer feedback whether it is positive or negative, prompted or unprompted.
Customer feedback is an insight into what is working well about your product or service and what should be done to make experience better. You might have the best expertise in the industry in which your company operates, but your professional knowledge will never be more valuable to business performance than customer insights. Their opinions help you ensure that the end product will actually meet their expectations, solve their problems and fulfill their needs.
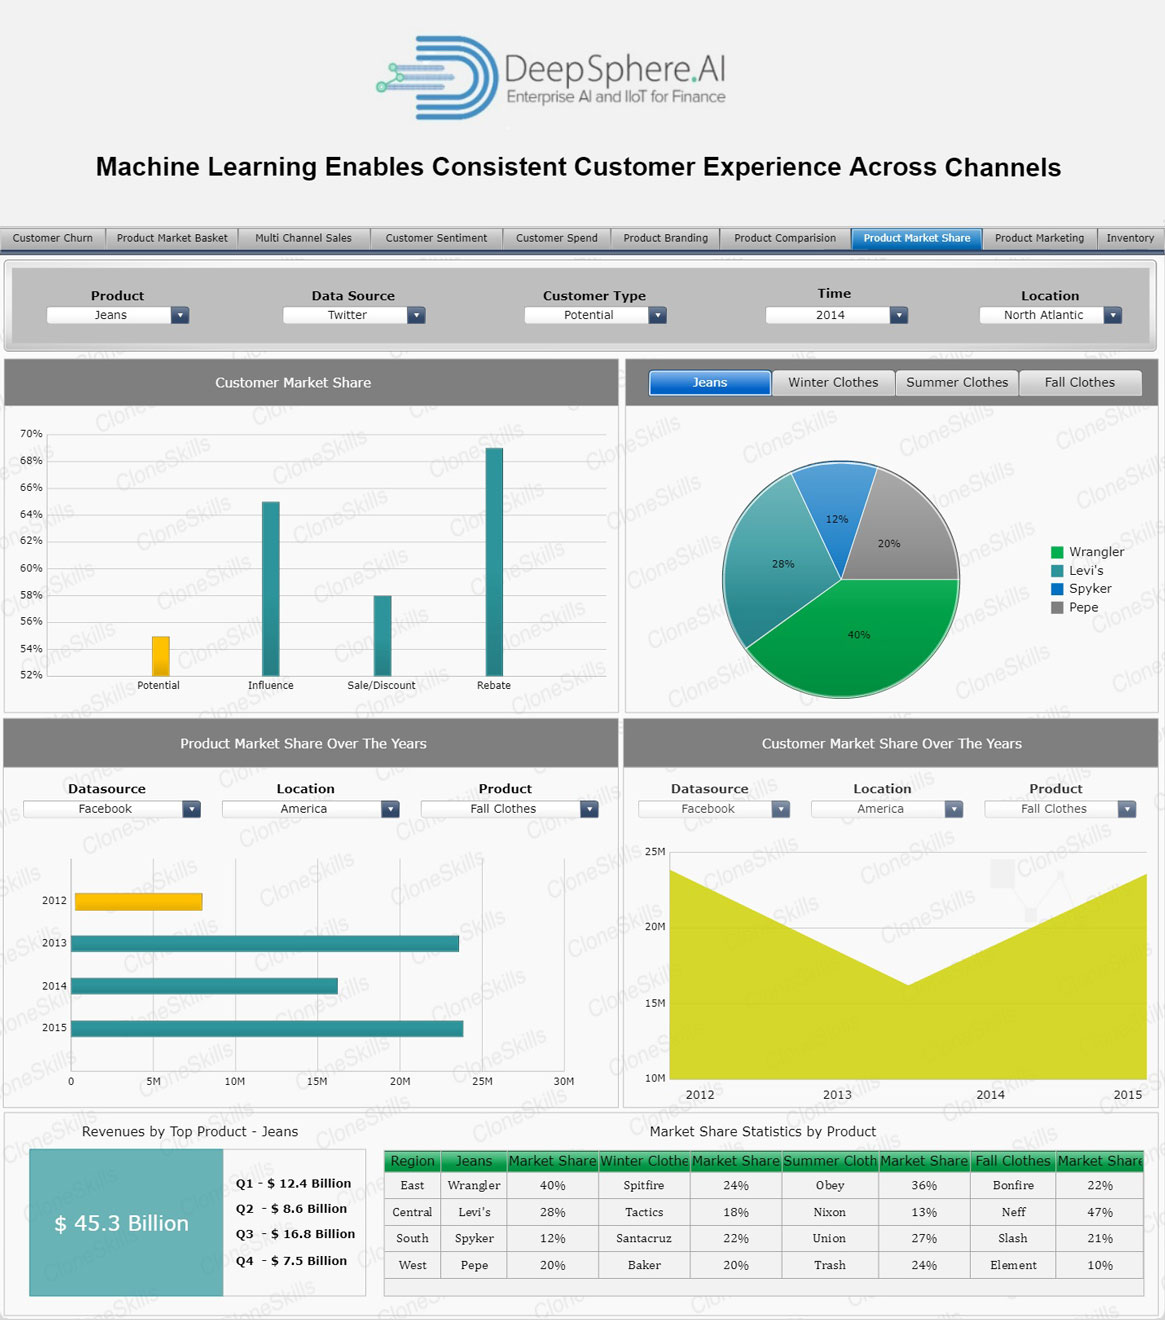
The term “Product Market Share”is defined as the percentage of share that goes to a company on total purchases of a customer of a product. In other words, if consumers as a whole buy 100 soaps, and 40 of which are from one company, that company holds 40% product market share.
When you are operating a small business, it can be difficult to succeed in a large market. Having a bigger share of the market gives you a greater ability to negotiate prices and sales terms with buyers and suppliers. To see just how big or small you are in your market, you can calculate the market share of your product. You can calculate this either using your revenues or your total units sold.
To Increase Market Share of a Product every organization or company that wants to be successful must continuously strive to increase its market share. But the fact is that most companies fall short by a great margin of their annual planning and projection. When the chips are finally counted at the end of the financial year and success is evaluated, the spreadsheet expectations often don’t meet reality. Even if expectations are met, the proper measure of success isn’t just the growth percentage of your market share, but the measure compared to your peers in the industry.
The term “Customer Market Share” refers to the percentage of an individual customer’s purchase of a product that is a single brand. The Customer Share by Category metric gives your team insight into how they should be marketing their content. If there seems to be a large instance of customers from the Healthcare/Hospital industry, the team may want to pivot marketing strategies to relate to possible users in that industry.
When it comes to existing customers, many business owners and managers become complacent. They fall into the trap of assuming that existing customers will come and buy from the business when they next need what the business sells. The truth is, however, that every business has at least one additional product or service they could sell to existing customers. And usually they have several additional products or services they could sell. But for some reason they don’t proactively market their additional products and services to their existing customers. Instead of focusing their marketing dollars on selling more stuff to who they already deal with, they focus on selling something to someone “new”. And that means they miss out on a huge amount of potential growth and profit.
If you are guilty of focusing more effort on getting new customers than selling to your existing customers, rise up to the following challenge. Pledge that, starting today, for one month, you will stop thinking about market share. Instead start thinking about customer share.
The term “Promotions” is the process of persuading a potential customer to buy the product. Sales promotion is designed to be used as a short-term tactic to boost sales. It is rarely suitable as a method of building long term customer loyalty. Some sales promotions are aimed at consumers. Others are targeted at intermediaries and at the firm's sales force.
There are many ways in which promotions are offered they are:
The term “Page Views” is recorded whenever a full page of your website is viewed or refreshed. The count of pageviews is the total number of times the pages of your website were viewed or refreshed within the selected time period. Pageviews are not uniquid.
How to convert website visitors into customers requires not only strategy, but extensive testing. You'd expect that a lot of traffic coming through to your website would automatically mean more customers and sales, yet it doesn’t. But why? There are so many factors as to why your potential customers are landing on your website but immediately taking off again. To name but a few: Your landing page isn’t in harmony with your inbound marketing efforts and has no focal point; what you're offering isn't strong enough and sign up forms are long winded.
Your website is vital in capturing your potential customers as 80-90% of them will use this to help them make their buying decision before getting anywhere near a sale. Meaning you really need to focus in on what you want them to do within the first few seconds of getting on to that landing page. Even before then though you need to be setting the bait for your future customers.
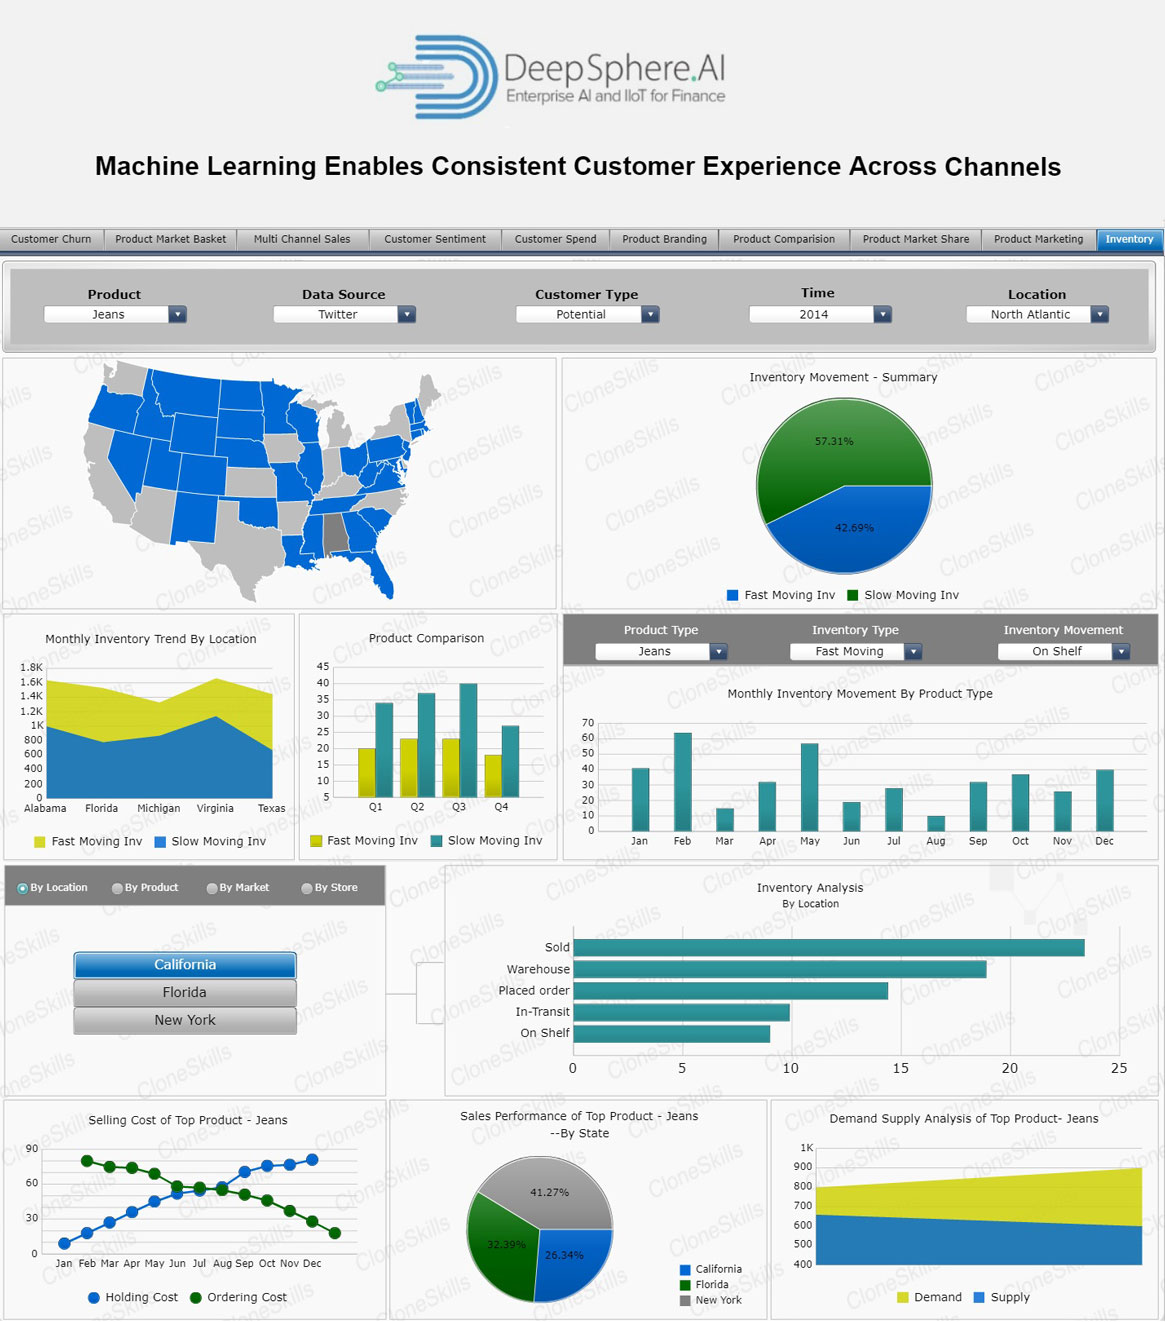
The term “Fast Moving Inventory” is a merchandise that sells within a couple of days and does not hold inventory storage space for long. They have a short shelf life because of high consumer demand ex: soda pop and confections or because they are perishable ex: meat, dairy products, and baked goods. These stocks are purchased frequently, are consumed rapidly, are priced low, and are sold in large quantities. They also have a high turnover when they're on the shelf at the store.
Fast moving inventories are purchased for consumption by the average consumer. They are divided into three different categories: durable, nondurable goods, and services. Durable goods have a shelf life of three years or more while nondurable goods have a shelf life of less than one year. They fall into the nondurable category, as they are consumed immediately and have a short shelf life. Nearly everyone in the world uses fast-moving inventories every day. They are the small-scale consumer purchases we make at the produce stand, grocery store, supermarket, and warehouse outlet. Examples include milk, gum, fruit and vegetables, toilet paper, soda, beer, and over-the-counter drugs like aspirin.
They Account for more than half of all consumer spending, but they tend to be low-involvement purchases. Consumers are more likely to show off a durable good such as a new car or beautifully designed smartphone than a new energy drink they picked up for $2.50 at the convenience store.
The term “Slow Moving Inventory” is a merchandise which simply stays locked up in the store’s space and has a really low sales rate. It generally includes the inventories which are greater than three months old. It is also defined as stock keeping units (SKUs) that have not shipped in a certain amount of time, such as 90 or 180 days, and merchandise that has a low turn rate relative to the quantity on hand. Slow moving inventories, not only varies from seller to seller, but it can also vary from item to item.
Slow moving inventory takes up valuable warehouse space & ties up capital. Therefore, it’s important for any online seller to come up with a plan of attack for dealing with merchandise that is slow moving. The most common method for dealing with it is to slash the price. Before you do that, though, it is recommended that you evaluate your marketing efforts, which may be a big part of the reason that the merchandise isn’t selling.
Dealing with slow-moving inventory requires you take action not only to address it but also lessen the chances of the stale inventory eating into your profits in the future. Inventory takes up valuable storage space, costs you money, and can reduce cash flow. Once you’ve identified your slow-moving inventory, it’s time to find ways to turn it over into cash to help your business keep moving.
The term “Holding Cost” are the costs incurred for storing and maintaining an inventory. These include real estate costs such as rents and bills, storage costs, insurance premiums, maintenance charges, staffing and equipment costs, and the like. For instance, a forklift truck used to move the stock in a warehouse is a holding cost. These costs seem to be negligible at first, and thus, are overlooked often. However, these costs could have a negative impact on a retail business in the long run. Thus, these costs need to be considered while deciding on a suitable business model for efficient inventory management.
Products that have high holding costs are generally slow-moving stocks, and those that have low holding costs belong to the fast-moving stock. Holding costs are associated with storing inventory that remains unsold. These costs are one component of total inventory costs, along with ordering and shortage costs. A firm’s holding costs include the price of goods damaged or spoiled, as well as that of storage space, labor and insurance. Minimizing inventory costs is an important supply-chain management strategy.
One way to ensure a company has sufficient cash to operate is to sell inventory and collect payments quickly. The sooner cash is collected from customers, the less total cash the firm must come up with to continue operations. Businesses measure the frequency of cash collections using the inventory turnover ratio, which is (cost of goods sold) / (inventory). For example, a company that has $1 million in cost of goods sold and an inventory balance of $200,000 has a turnover ratio of 5. The goal is to increase sales and reduce the required amount of inventory, so that the turnover ratio increases.
The term “Ordering Cost” are the expenses incurred to create and process an order to a supplier. These costs are included in the determination of the economic order quantity for an inventory item. There will be an ordering cost of some size, no matter how small an order may be. The total amount of ordering costs that a business incurs will increase with the number of orders placed. This aggregate order cost can be mitigated by placing large blanket orders that cover long periods of time, and then issuing order releases against the blanket orders.
Cost of procurement and inbound logistics costs form a part of Ordering Cost. Ordering Cost is dependent and varies based on two factors. The cost of ordering excess and the Cost of ordering too less. Both these factors move in opposite directions to each other. Ordering excess quantity will result in carrying cost of inventory. Where as ordering less will result in increase of replenishment cost and ordering costs. These costs together are called Total Stocking Cost. If you plot the order quantity vs the TSC, you will see the graph declining gradually until a certain point after which with every increase in quantity the TSC will proportionately show an increase.
This functional analysis and cost implications form the basis of determining the Inventory Procurement decision by answering the two basic fundamental questions - How Much to Order and When to Order. How much to order is determined by arriving at the Economic Order Quantity or EOQ.
“Sales Performance” is the measurement of sales activity against the goals outlined in a companies sales plan. The simplest method of tracking sales performance is to establish sales goals for your team and for individual team members and then evaluate performance, either monthly or quarterly. You can then improve performance using new processes and sales tools.
A successful sales plan will include companies sales objectives, strategies, and tactics for generating sales revenue from both existing and new customers. Essential to any effective sales plan is defining how a company will measure sales performance and progress. To make it easy to measure performance, most high-performing sales teams track their plan’s objectives in their CRM.
Client Relationship Management software, or CRM, is a tool for managing leads, contacts, and sales opportunities as they move through companies sales process. A CRM built for small businesses can help companies keep track of all of the leads, deals, customers, and processes involved in your sales cycle. Some CRMs can also make your life easier by automating pieces of the sales process.
Demand & Supply is perhaps one of the most fundamental concepts of economics and it is the backbone of a market economy. ”Demand” refers to how much (quantity) of a product or service is desired by buyers. The quantity demanded is the amount of a product people are willing to buy at a certain price; the relationship between price and quantity demanded is known as the demand relationship. “Supply” represents how much the market can offer. The quantity supplied refers to the amount of a certain good producers are willing to supply when receiving a certain price. The correlation between price and how much of a good or service is supplied to the market is known as the supply relationship. Price, therefore, is a reflection of supply and demand.
The relationship between demand and supply underlie the forces behind the allocation of resources. In market economy theories, demand and supply theory will allocate resources in the most efficient way possible. Time is important to supply because suppliers must, but cannot always, react quickly to a change in demand or price. So it is important to try and determine whether a price change that is caused by demand will be temporary or permanent.
Example: If there's a sudden increase in the demand and price for umbrellas in an unexpected rainy season; suppliers may simply accommodate demand by using their production equipment more intensively. If, however, there is a climate change, and the population will need umbrellas year-round, the change in demand and price will be expected to be long term; suppliers will have to change their equipment and production facilities in order to meet the long-term levels of demand.
Definition: The term “Gas Emission” is defined as the emission into the earth's atmosphere of any of various gases, especially carbon dioxide, that contribute to the greenhouse effect. Greenhouse gases include carbon dioxide (CO2), methane (CH4) and nitrous oxide (N2O), occurring naturally and as the result of human activity.
Indirect greenhouse gas (GHG) emissions from oil and gas operations, including both carbon dioxide and methane emissions, today are around 5 200 million tones (Mt) of carbon-dioxide equivalent. These emissions which do not include any emissions associated with the actual consumption of the fuel amount to around 15% of the energy sector’s total GHG emissions. For gas, indirect emissions sources are between 15% and 40% of its full lifecycle emissions intensity. This means that around 97% of gas consumed today has a lower lifecycle emissions intensity than coal. Nevertheless, the aim for the future should be to focus on cost-effective ways to minimize the gap between gas and zero-carbon technologies rather than focus on the gap between coal and gas.
Definition: Oil company “Assets” are classified in three main divisions: upstream, midstream and downstream. Upstream operations are the exploration for oil and gas and the appraisal, development and production of any discovery, and most oil companies do not own equipment for upstream activities; they hire contractors to perform services such as geophysical surveys, well drilling and geological and environmental studies. Midstream assets are linked to the initial processing, storage and transportation of oil and gas. Crude oil refining into products such as gasoline, kerosene and diesel is a downstream activity, as is the product distribution to and marketing by a retail network.
Definition: The term “Asset Value” represents the net value of an entity and is calculated as the total value of the entity’s assets minus the total value of its liabilities. In the context of companies and business entities, the difference between the assets and the liabilities is known as the net assets or the net worth or the capital of the company.
In restructurings involving oil and gas reserves, the asset valuation analyses are often more complex because of the technical data and skillset required to value these reserves. Although valuing oil and gas assets is not necessarily more difficult than valuing other asset classes, valuing these types of assets requires a detailed understanding of the relative merits of traditional valuation methods.
Valuing oil and gas assets, which comprise a depleting asset base where value is correlated to constantly changing commodity prices and historical production trends, demands a thorough understanding of the technical details included in a company’s reserve database. Although commodity prices fluctuate, the value estimates of the underlying oil and gas assets should be based on current conditions, and are not intended to reflect unforeseeable economic or environmental events that could alter the fair market value subsequent to the valuation date.
Definition: The term “Proven reserves” is the quantity of natural resources that a company reasonably expects to extract from a given formation. Proven reserves are established using geological and engineering data gathered through seismic testing and exploratory drilling. In oil and gas extraction, once the physical shape of a formation is understood, the reservoir is estimated by fluid contacts. Fluid contacts refer to the natural layering of gas, oil and water in a formation. An accurate picture of the formation shape and known levels of fluid contact provide the data for a volume estimate with a high degree of confidence. Proven reserves are classified as having a 90% or greater likelihood of being present and economically viable for extraction in current conditions. Proven reserves are also referred to as proved reserves.
Proven reserves also take into account the current technology being used for extraction, regional regulations and market conditions as part of the estimation process. For this reason, proven reserves can seemingly take unexpected leaps and drops. Depending on the regional disclosure regulations, extraction companies might only disclose proven reserves even though they will have estimates for probable and possible reserves.
Definition: The term “Oil Lease” is essentially an agreement between parties to allow a Lessee (the oil and gas company and their production crew) to have access to the property and minerals (oil and gas) on the property of the Lessor. The lease agreement is a legal contract of terms. It contains certain elements, which confirm all the terms of the agreement. The lease must be dated and the lease also sets the time that the lease is effective. It establishes the primary term of the lease.
Of great importance to the landowner, the Lessor, is the royalty clause. This clause states the percentage or share of production proceeds that the Lessor receives and how the royalty is received. The Lessee is given rights in the drilling and delay rental clause. This allows the Lessee to defer immediate use of the property if the Lessee completes the obligation within a period of time and pays delay rental.
Definition: There are numerous terms and conditions listed in an oil and gas lease. One is “Pooling”, and it is contained in most leases. In most states, landowners may be subjected to two types of pooling arrangements. One is voluntary and the other is compulsory or statutory. In order for pooling to occur, the mineral rights’ owner must consent. By consenting to a pooling arrangement, the landowner must be careful because the utilization of pooling can materially alter the lease provisions. For example, potential royalties can be significantly reduced because the pooling provisions reduce the number of wells necessary to keep the lease in effect.
Pooling is the combination of all or portions of multiple oil and gas leases to form a unit for the drilling of a single oil and/or gas well. The unit is generally one or a combination of government survey quarter-quarter sections. Generally the interest owners in the pooled unit share the revenue from the well on the basis of surface acreage or mineral acreage owned by each interest owner in the pooled unit.
Pooling can impact the lease provisions, which may provide some unpleasant surprises as to the extent it can impact the lease. (We will discuss these in part 2 of this series.) Here are some things landowners might want to keep in mind when granting the rights to pool the leased premises. These can prevent unexpected and negative consequences from granting the right to pool.
Definition: A “Mineral Deed” is a legal document which contains the details about the transfer of any mineral rights, royalty interests and overriding royalty interest owned by any royalty interest owner to oil and gas mineral acquisition organizations or any drilling organization with a warranty of title or without a warranty of title. If the title is not warranted in a legal document, then this mineral deed is considered as a quitclaim deed.
In the oil and gas industry, the entity who owns the mineral rights is called the grantor and when the grantor transfers royalty interests to another entity, the other entity is called the grantee. In simple terms an owner of the property or a grantor can own surface area of the property as well as minerals down below the property. Both the surface area of a property and the minerals below this surface area are treated as two separate legal interests. If these rights need to be transferred to any other entity, such as oil and gas operating organizations or minerals and royalty acquisition organizations, it can be done by signing the mineral deed which legally conveys the actual rights to the minerals while still remaining separate from the surface rights.
Definition: The term “Acreage” is defined as the amount of leased real estate that a petroleum and/or natural gas company has a working interest in. Gross Acreage is different from net acreage if a company shares its working interest with another company or companies. The company's true interest is expressed in net acres. Net acreage is calculated by multiplying the company's percentage interest by the gross acreage. If a company holds the entire working interest, its net acreage and gross acreage will be the same.
A company's number of gross acreage is an indication to investors of the company's size, market position and current activity. However, a company's acreage does not tell the whole story. A potential investor needs to investigate what the company is doing with that acreage. Is it drilling wells? If so, at what pace? How many barrels of oil is the area producing and how many is it expected to produce?
Larger companies will usually have an interest in hundreds of thousands of gross acres, while smaller ones may only have an interest in tens of thousands of gross acres. The largest companies will have total holdings of millions of gross acres.
Definition: The primary lease term has an ending date that applies if the land is not actually drilled or producing minerals for the lessee. If at this date nothing is being done on the land, the lease expires. This changes completely if the lessee is in the process of drilling whether producing gas and oil or not. If there is active exploration or drilling going on that began prior to the primary term's expiration date, the lease is still considered to be in effect provided the company does not stop work for longer than 90 days.
In other words, as long as a lessee engages in drilling even one day prior to the end of the contract, they are allowed to keep doing so to either produce minerals or determine a well is dry. The lessee can drill as many holes as they wish, exploring beyond the lease expiration date, provided they continue to do so with the intent to produce. This automatic extension is said to be the secondary lease term.
When leasing gas and oil rights, when the secondary lease term goes into effect there certain things can happen. The drilling company can continue exploring the land until they begin to produce oil and gas, regardless of how long that takes as long as efforts do not lapse for greater than 90 days. If and when they are able to produce minerals, they are also permitted to continue doing so provided they do not cease production for longer than 60 days.
Definition: An “Oil Well” is a boring in the Earth that is designed to bring petroleum oil hydrocarbons to the surface. Usually some natural gas is released along with the oil. A well that is designed to produce only gas may be termed a gas well. There are numerous different ways that oil well can be drilled to maximize the output of the well while minimizing other costs. The most common type of well drilled today is known as a conventional well. These wells are wells drilled in the traditional sense in that a location is chosen above the reservoir and the well is drilled vertically downward. Additionally, wells with a small amount of deviation in their path from the vertical are also considered to be conventional. This slight turning of the well is obtained during drilling by using a type of steerable device that shifts the direction the well is being dug. These wells are the most common and are fairly inexpensive to drill.
Horizontal wells are an alternative type of well used when conventional wells do not yield enough fuel. These wells are drilled and steered to enter a deposit nearly horizontally. These wells can hit targets and stimulate reservoirs in ways that a vertical well cannot. Combined with hydraulic fracturing previously unproductive rocks can be used as sources for natural gas. Examples of these types of deposits include formations that contain shale gas or tight gas.
Other types of wells include offshore wells, which are wells that are drilled in the water instead of onshore. These provide access to previous inaccessible oil deposits. Multilateral wells are wells used occasionally that have several branches off of the main borehole that drain a separate part of the reservoir.
Definition: The term “High Consequence Area Miles” is a buffer that usually extends 660 feet (200 meters) to either side of a segment of pipeline which passes through developed areas where people live in an urban or suburban setting, or where they frequently gather, like a school. Pipelines within an HCA are required to have extra safety features or extra precautions must be taken by pipeline operators depending on the type of pipeline, the material being conveyed, and other factors.
Although commonly assumed to run through areas with a high population density, that is not the full picture of how HCAs are designated. There is a detailed process that pipeline operators (the pipeline companies) must follow to determine where an HCA is located. Pipeline operators are required to establish and implement a higher level of safety features for pipelines within an HCA compared to pipelines outside an HCA. Thus, any property within an HCA will have greater safety protections.
A random pipeline leak or some other malfunction could possibly occur on any segment of a given pipeline, either inside or outside an HCA. However, because the land within an HCA is usually more densely populated, a leak inside an HCA could cause more harm and injuries than the very same sort of leak outside an HCA. In other words, there are more safety provisions with an HCA because more people are living or gathering there. It is not the type or condition of the pipeline which causes a HCA to be established, but rather the population density, types of land use, and features of the lands near the pipeline.
Definition: An operator is required to temporarily reduce operating pressure or shut down the pipeline until the operator could complete the repair, basing the temporary operating pressure reduction on remaining wall thickness. immediate repair conditions are those where the indicated anomaly may suggest the potential for imminent failure. However, API objected to limiting an operator's actions to address these conditions to repair of the condition. API recommended renaming these immediate concern conditions, and allowing an operator to take actions other than repair.
To maintain safety, an operator must temporarily reduce the operating pressure or shut down the pipeline until the operator completes the repair of these conditions. An operator must calculate the temporary reduction in operating pressure. If no suitable remaining strength calculation method can be identified, an operator must implement a minimum 20 percent or greater operating pressure reduction, based on actual operating pressure for two months prior to the date of inspection, until the anomaly is repaired.
Definition: Many pipeline accidents have proven that the damage from a leak that impacts a high consequence area, known as a HCA, is greatly compounded and endures far longer than leaks elsewhere. HCAs also include populated areas and sensitive ecological resources including locations where federally listed threatened and endangered species can be found, and areas where migratory water birds concentrate. Good engineering practices and pipeline regulations require pipeline operators to augment the leak detection systems on sections where a pipeline failure could affect a high consequence area.
The leak detection systems that cover the entire length of a cross-country pipeline often lack sufficient intermediate sensors and are limited in their ability to detect and locate very small leaks close to a HCA. If a secondary leak detection system is added with sensors installed immediately upstream, and downstream of the HCA section, this new system can be tuned to much higher sensitivity, as its sensors will isolate the HCA section from influences elsewhere along the pipeline.
Definition: The failure of a high-pressure natural gas pipeline can lead to various outcomes, some of which can pose a significant threat to people and property in the immediate vicinity of the failure location. The dominant hazard is thermal radiation from a sustained jet or trench fire. An estimate of the ground area affected by a credible worst-case failure event can be obtained from a model that characterizes the heat intensity associated with rupture failure of the pipe where the escaping gas is assumed to feed a sustained trench fire that ignites very soon after line failure.
An equation has been developed that relates the diameter and operating pressure of a pipeline to the size of the area likely to experience high consequences in the event of an ignited rupture failure. The model upon which the hazard area equation is based consists of three parts: 1) a fire model that relates the rate of gas release to the heat intensity of the fire as a function of distance from the fire source; 2) an effective release rate model that provides a representative steady-state approximation to the actual transient release rate; and 3) a heat intensity threshold that establishes the sustained heat intensity level above which the effects on people and property are consistent with the adopted definition of a so-called High Consequence Area.
The validity of the proposed model is established by a comparison between the predicted extent of the damage area and the actual extent of damage for significant gas pipeline failure incidents reported in the public domain.
Definition: The term “OSHA Recordable Injuries” is defined as Recordable work-related injuries and illnesses are those that result in one or more of the following: medical treatment beyond first aid, one or more days away from work, restricted work or transfer to another job, diagnosis of a significant injury or illness, loss of consciousness, or death. Injuries may include cases such as a cut, fracture, or sprain. Illnesses may include both acute and chronic illnesses such as a skin disease, respiratory disorder, or allergy. All needle sticks and sharps injuries involving exposure to blood or other potentially infectious materials are included.
The OSHA Act regulations also indicate that cases involving cancer, chronic irreversible disease, a fractured or cracked bone, or a punctured eardrum must always be recorded. An injury is considered work-related if an event or exposure in the workplace caused or contributed to the condition or significantly aggravated a pre-existing condition. Injuries that are not work-related include those that occur to the general public, certain parking lot accidents, non-work-induced mental illnesses, colds or flu, injuries that arise from personal meals or grooming, injuries that are self-inflicted or from self-medication, and those occurring on the premises due to outside factors (such as a natural disaster).
Definition: The term “OSHA Recordable Illness” is defined as illness that is work- related & if an event or exposure in the work environment caused or contributed to the condition or significantly aggravated a preexisting condition. Work- relatedness is presumed for injuries and illnesses resulting from events or exposures occurring in the workplace, unless an exception specifically applies.
Many employers with more than 10 employees are required to keep a record of serious work-related illnesses. This information helps employers, workers and OSHA evaluate the safety of a workplace, understand industry hazards, and implement worker protections to reduce and eliminate hazards preventing future workplace injuries and illnesses. The records must be maintained at the worksite for at least five years. Each February through April, employers must post a summary of the injuries and illnesses recorded the previous year. Also, if requested, copies of the records must be provided to current and former employees, or their representatives.
Definition: Oil & Gas workers are nearly ten times as likely to die or be seriously injured in a motor vehicle accident on the job as people who work in any other profession. The study, conducted between 2003 and 2009, found that almost one-third of all work-related deaths in the oil and gas industry were caused by motor vehicle accidents. The oil industry is inherently dangerous and those dangers are vividly illustrated in the many newsworthy accidents that have been reported across the globe.
The National Institute for Occupational Safety and Health (NIOSH) notes that motor vehicle crashes are responsible for 29 percent of all work-related deaths in the industry. From 2003 to 2009, some 202 oil and gas extraction workers died in work-related motor vehicle accidents a rate 8.5 times higher than for private wage and salary workers. Many motor vehicle accidents affecting industry employees occur on sprawling work sites, and the location of those sites is often remote, reached by rural, poorly maintained roads that lack firm shoulders, adequate signage and other safety features. Hauling heavy equipment to out-of-the-way operations or merely going to and from work can be hazardous in itself. Many remote sites lack housing, causing workers to drive many miles and hours sometimes to commute.
Definition: Work in the oil and gas industry is associated with many risks. These dangers increase when rig owners negligently attempt to save money, get the job done quicker, or fail to maintain safety protocols. Much offshore gas and oil exploration takes place many miles beneath the ocean. As well as involving some seriously complex equipment, oil platforms can also be dangerous places, with numerous environmental hazards to deal with. Well drilling has taken place for thousands of years, and since then there have been numerous gas related accidents have been reported which have had a serious impact both on human life and the environment. There is a positive side to this, though virtually every accident has led to safety reviews, and helped to improve safety protocols and equipment.
Definition: The term “Drilling Depth” is defined as the original depth recorded while drilling an oil or gas wellIn Other words it is defined as the depth required to drill to extract crude Oil. The average depth of oil wells drilled was 3,635 feet. Since oil takes millions of years to form, for all intents and purposes, it’s a finite resource. Oil & Gas Companies are drilling deeper because they are literally running out of oil. But depth comes at a cost. Deep offshore drilling requires more money and energy, not to mention hazards for both the environment and workers.
Drilling on land is an undertaking on its own. How do you drill in lightless ocean depths and transport all that liquid, gas and solid petroleum back to the surface? How do you keep from polluting the ocean? And how do you do all of this, with tons of special equipment, in the middle of rough seas? Even today, scientists say that oil in the Gulf of Mexico continues to poison wildlife and poses a public risk.
Tracking and recording of drill pipe at the rig site starts when individual joints are picked up. Joint numbers are manually marked on the side of the pipe. Typically three sections of pipe are joined together into a stand (of about 27–29 m in length) and stacked in rows of 10, with their base resting on the drill floor. Prior to running in the hole each stand is manually measured with a steel tape measure and the measurement recorded in a computer spreadsheet (previously a pipe tally book was used) alongside the stand number. To confirm at any stage what depth the drill bit is operating at, the driller consults the pipe tally records, and measures the length of the current stand of drill pipe below the rig floor.
Definition: The term “Non Productive Time” is defined as time during which drilling operation is ceased or penetration rate is very low. Time spent on fishing, pipe stuck, weather, tool transportation, lost circulation and tripping in/out can be counted as Non Productive Time (NPT). No well is drilled without problems. Managing drilling risk means not letting small problems become big ones. Knowing what the risks are and when they are likely to occur keeps surprises to a minimum. Most of the time spent drilling, and most of the cost, is encountered not in the reservoir, but in getting to it. The NPT events have been divided into two categories; geological or subsurface related and other issues or (non- geological related). The NPT events in drilling operations currently account for 18% of total drilling time in the selected wells and the analysis showed that waiting water and lost circulation are major causes of NPT in the selected wells in the Ghadames Basin.
Non-productive time in offshore drilling and completion is a huge cost to the oil industry and, while many causes have been dealt with, tool failure is the main concern. In the complex and capital-intensive world of offshore drilling, downtime is expensive. The cost to oil producers of non-productive time (NPT) is huge, and although the industry has done very well in combating many of the causes, there remain urgent problems to address to ensure efficient operation.
Non Productive Time (NPT) brings to mind money wasted, time wasted, failures, budget overruns, unreliability, breakdowns, inefficiencies, plans gone awry, and many more of the unpleasant elements of a drilling operation. But perhaps NPT is not as bad as it seems.
Definition: The Fuel losses incurred as a result of a catastrophic crude oil spill can sink entire operations, and often make headline news. However, far more revenue is lost through day-to-day shipping incidents and low-level negligence. This can be mitigated through the proper introduction of loss-prevention mechanisms. There are many reasons for the loss of fuel in transit, and therefore a multifaceted approach to ensuring efficiency, profit retention, and safety must be taken.
Fuel losses can sometimes occur due to negligence on basic safety requirements needed for operations. With ever-more rapid technological advancements, the detection and correction of oil handling equipment can be streamlined to guarantee transportation safety. Efficiency can be enhanced through the use of such technology-based tools and equipment that can help monitor any leakages and failures on the oil-carrying vessels. A considerable volume of oil gets wasted during both operations and handling. For this reason, the use of oil tanks should be well planned and diligently monitored to cut down on losses due to evaporation.
Definition: Incidents or Accidents during Lifting and rigging work tasks are called as “Rigging & Lifting Incidents”. Lifting and rigging work tasks are considered a high hazard task by many oil & gas companies. There are a lot of associated hazards that accompany lifting any loads with cranes or equipment. It is important to not only understand proper rigging techniques, but also the other hazards that accompany this type of work task.
The first type of incident regarding lifting and rigging is some type of breakage of a sling, wire rope, or chain resulting in a dropped load. While these type of incidents usually have the most severe consequences, there are often many other types of less severe incidents that cause the majority of injuries or property damage. Some of the other injuries and incidents that occur are sprains, falls, crush injuries, electrocutions, and struck-by incidents.
Hazards such as swinging loads, manual handling of heavy rigging, holding on to tag lines, moving equipment, pinch points, working on elevated surfaces, trip hazards, slippery surfaces, etc. can all be present during lifting operations.
Definition: The term “Production Spend” is defined as the amount that an oil & gas company spends in crude oil production. For decades, higher production from oil companies was what the market wanted and rewarded. But in the last couple of years, it has become clear that what is desired, often voiced and certainly rewarded, is slower production growth and reined-in spending.
Unconventional production from shale, particularly shale oil, are the product of years of innovation. In particular, during the industry downturn between 2015-2017, E&P companies hacked away at their spend and forced down their breakeven prices. The industry has more than doubled production since 2011, and the fastest growth has been in the last couple of years.Definition: The term “Research & Development Spend” is defined as the amount that an oil & gas company typical spends on research & development activities. Research and Development spend reflects a company’s commitment to long-term growth through innovation. Companies sacrifice short-term earnings to develop innovative technologies to stay ahead of their peers.
Research & Development is a leading indicator of the direction of change in an industry. But even as Shell and its oil major peers say they are preparing for a greener future, their spending is still largely focused on their legacy fossil fuels businesses. Royal Dutch Shell’s research and development center in Amsterdam, scientists and engineers are experimenting with new ways to thrive as the world shifts towards cleaner fuels from hydrogen dispensers at fueling stations to injecting carbon back into underground reservoirs after oil and gas extraction.
Statistic show that Royal Dutch Shell's spending on research and development ranges 900 to 1400 million US Dollars. In 2010, the company spent some 1.02 billion U.S. dollars on R&D. Royal Dutch Shell is one of the leading oil and gas companies worldwide, operating in every segment of the oil and gas industry. The company is headquartered in the Hague, Netherlands. In 2018, R&D spending was 986 million U.S. dollars.
Definition: A utility derived from every purchase or every sum of money spent. Spend Value for money is based not only on the minimum purchase price (economy) but also on the maximum efficiency and effectiveness of the purchase. The oil and gas sector plays an important role in the economy by drilling, extracting, and processing oil and gas. Because operational spend vary widely with the size of oil and gas companies, average operating expenses tend to be meaningless.
Financial professionals typically assess the average operational spend by looking at the average operational spend margin, which is expressed as the percentage of operational spend in the sector's total revenues. In July 2015, the average operational spend margin for the oil and gas industry was approximately 33%. Given the average revenue of $60 billion over the last four quarters, the average operating expense in the oil and gas sector stands at approximately $19.5 billion per company.
Definition: The term “Spend Growth Rate” is defined as the rate at which an oil & gas company spends in exploration, production & development activities. The oil and gas sector plays an important role in the economy by drilling, extracting, and processing oil and gas. Because operational spend vary widely with the size of oil and gas companies, average operating expenses tend to be meaningless.
Financial professionals typically assess the average operational spend by looking at the average operational spend margin, which is expressed as the percentage of operational spend in the sector's total revenues. In July 2015, the average operational spend margin for the oil and gas industry was approximately 33%. Given the average revenue of $60 billion over the last four quarters, the average operating expense in the oil and gas sector stands at approximately $19.5 billion per company.
Definition: The term “Purchase Order Accuracy” is defined as the Percentage of purchase orders with line item, pricing, supplier data, quantity or delivery date and address errors over total number of purchase orders per period of time. Can be different for different buying channels. Purchase order accuracy is necessary for the manufacturing planners to know when the raw materials will be available to release the required manufacturing orders. If items are purchased and then distributed to customers, having accurate purchasing information allows the ATP and CTP functions to accurately project when a customer may expect an order.
The process to validate purchase orders is very similar to the process to validate work orders and sales orders. This is an ongoing operation where the problem orders will quickly rise to the top as past due. Similar to the process for customer demand, examine the first page of a purchase order listing by due date. All purchase orders should have an expected delivery date that is sometime in the future. Realizing that not all suppliers are on time with all deliveries, means that this process must be under constant review to ensure that valid due dates are being fed into the system initially and maintained with the passage of time.
Definition: The “Supplier Corrective Action Request (SCAR)” is the is a systematic approach to request investigation of a problem that already happened and request root cause analysis and resolution from supplier to prevent recurrence. A supplier quality action report (SCAR) was derived from the need to issue suppliers a corrective action to a problem that occurred due to their product or service. As a way to differentiate this from an internal corrective action, somebody out there decided to call it a SCAR. Basically, it’s a formal request to a supplier to correct a problem and explain exactly how it will do so. The Time taken for resolution of problem that already happened and request root cause analysis is termed as “SCAR Resloution Time”
Definition: The “Supplier Corrective Action Request (SCAR)” is the is a systematic approach to request investigation of a problem that already happened and request root cause analysis and resolution from supplier to prevent recurrence. A supplier quality action report (SCAR) was derived from the need to issue suppliers a corrective action to a problem that occurred due to their product or service. As a way to differentiate this from an internal corrective action, somebody out there decided to call it a SCAR. Basically, it’s a formal request to a supplier to correct a problem and explain exactly how it will do so. The Time taken for respond to a problem that already happened and request root cause analysis is termed as “SCAR Response Time”
Definition: The term “On-Time Delivery” is a measure of process and supply chain efficiency which measures the amount of finish goods or services delivered to customers on time and in full. It helps determine how efficiently we are meeting our customer's or agreed deadlines. If the figure is too low or below the benchmark it could be used as a signal that somewhere along the supply chain there are bottlenecks, inefficient or time consuming processes which are not adding value and warrant further investigation or a slower delivery method is being employed.
On-Time delivery is a very simple measure but sometimes overlooked in many organizations, and it is simply calculated as the amount of units or shipments delivered on time versus total orders shipped. On-time delivery (OTD) is a key metric to measure delivery performance and supply chain efficiency in any company. The On-time delivery performance refers to the ratio of customer order lines shipped on or before the requested delivery date / customer promised date versus the total number of order lines. This is usually expressed as a percentage and can be calculated for several measurement periods.
Definition: The term “Vendor Score” is an aggregate rating of the various quality-related performance metrics for the supplier. Scores for various quality metrics are multiplied by their weighting and the summation provides the overall quality score for the supplier. Vendor Score is an evaluation metric used to assess the performance of suppliers. Vendor Score can be used to keep track of item quality, delivery and responsiveness of suppliers across long periods of time. This data is typically used to help in purchasing decisions. A Vendor Score is manually created for each supplier.
Definition: The “Rate of Quality Delivery” is one of the performance measure to evaluate Supplier performance. It measures whether your supplier is doing their work as expected at a right time. As levels of supply chain integration have increased and inventory levels have been reduced, reliable, on-time deliveries have become increasingly critical for success.
Large inventories and production capacities were traditionally required to ensure on-time delivery. However, with advanced information systems, deregulation, agile manufacturing organizations with flexible equipment and tooling, and sophisticated logistics systems, integrated supply chains no longer need large, costly inventory buffers to respond to unexpected events and variations in demand.
Definition: The term “Billed Revenue” means the aggregate amounts billed to customers and clients by the Purchased Subsidiaries and their Subsidiaries or by any Affiliate of the Buyer to the extent such billings arise out of the Business. Uncollectable Revenue is defined as total Billed Revenue that is uncollected and past due, and includes bad debts, fraudulent charges, short payments by Users, and other payment shortfalls and delinquencies.
Revenue recognition, particularly for upstream activities, can present challenging issues. Production often takes place in joint ventures or through concessions, and entities need to analyze the facts and circumstances to determine when and how much revenue to recognize. Crude oil and gas may need to be moved long distances and need to be of a specific type to meet refinery requirements
Definition: The term “Unbilled Revenue” is defined as the revenue that has been earned by providing a good or service, but for which no payment has been received because the customer has yet to be billed. Billed revenues are recorded as receivables on the balance sheet to reflect the amount of money that customers owe the business for the goods or services they purchased.
Billed Revenue is a feature of accrual accounting and the matching principle, which is an accounting concept that matches revenues with expenses, regardless of when cash transactions occur. It requires that transactions be recorded in the same accounting period in which they are earned, rather than when the cash payment for the product or service is received. Under generally accepted accounting principles (GAAP), Billed revenue is recognized when the performing party satisfies a performance obligation, ie., a sale has occurred and is finalized.
Revenue recognition, particularly for upstream activities, can present challenging issues. Production often takes place in joint ventures or through concessions, and entities need to analyze the facts and circumstances to determine when and how much revenue to recognize. Crude oil and gas may need to be moved long distances and need to be of a specific type to meet refinery requirements
Definition: The term “Cost of Restoration” is defined as the cost of restoring a damaged, lost or destroyed Asset or Equipment's to a condition reasonably comparable to its pre-Casualty Loss condition. Cost of Restoration includes:
Definition: The term “Cost of Replacement” is defined as an expense a business must undertake to replace an essential asset of the company at the same or equal value. The asset to be replaced could be equipment, machines, investment securities, accounts receivable or liens. The replacement cost can change, depending on changes in the market value of the asset and any other costs required to prepare the asset for use. Accountants use depreciation to expense the cost of the asset over its useful life.
Replacing an asset can be an expensive decision, and companies analyze the net present value (NPV) of the future cash inflows and outflows to make purchasing decisions. Once an asset is purchased, the company determines a useful life for the asset and depreciates the asset's cost over the useful life. As part of the process of determining what asset is in need of replacement and what the value of the asset is, companies use a process called net present value. To make a decision about an expensive asset purchase, companies first decide on a discount rate, which is an assumption about a minimum rate of return on any company investment.
Reserve replacement cost (RRC) is calculated by dividing development, exploitation, exploration and acquisition capital expenditures, reduced by proceeds of divestitures, for the period by net estimated proved reserve additions for the period from all sources, including acquisitions and divestitures. Our calculation of reserve replacement cost includes costs and reserve additions related to the purchase of proved reserves.
Definition: The term “Operating Revenue” is defined as the revenue generated from a company's primary business activities. Distinguishing operating revenue from total revenue is important as it provides valuable information about the productivity and profitability of a company's operations. Despite recording operating revenue separately on financial statements, some firms may attempt to mask decreases in operating revenue by combining it with non-operating revenue. Understanding and identifying the sources of revenue is helpful in assessing the health of a firm and its operations.
Operating Revenues are the result of the sale of production, oil & gas, from the wells. Operating Revenues can also result from services provided or the gains on equipment sold. Cost of Goods Sold are the costs related to the sales of production or services provided. Expenses are the costs incurred in order to operate the wells and company. Because Operating Revenue vary widely with the size of oil and gas companies, average operating revenue tend to be meaningless. Financial professionals typically assess the average operating revenue by looking at the average operating revenue margin, which is expressed as the percentage of operating revenue in the sector's total revenues.
Definition: The term “Operating Expense” is defined as the is an expense a business incurs through its normal business operations. Often abbreviated as OPEX, operating expenses include rent, equipment, inventory costs, marketing, payroll, insurance, and funds allocated for research and development. One of the typical responsibilities that management must contend with is determining how to reduce operating expenses without significantly affecting a firm's ability to compete with its competitors.
The oil and gas sector plays an important role in the economy by drilling, extracting, and processing oil and gas. Because operating expenses vary widely with the size of oil and gas companies, average operating expenses tend to be meaningless. Financial professionals typically assess the average operating expenses by looking at the average operating expenses margin, which is expressed as the percentage of operating expenses in the sector's total revenues. In July 2015, the average operating expenses margin for the oil and gas industry was approximately 33%. Given the average revenue of $60 billion over the last four quarters, the average operating expense in the oil and gas sector stands at approximately $19.5 billion per company.
Definition: The term “Maintenance Cost” is defined as costs incurred to keep an item in good condition or good working order. When purchasing an item that requires upkeep consumers should consider the initial price tag as well as the item's ongoing maintenance expenses. Such Costs are major reasons why home ownership can be more costly than renting. Sometimes items that are merely leased and not owned, such as a leased car, will require the operator to pay maintenance costs.
The significant lifetime cost of equipment maintenance after initial purchase can be shocking in the oil and gas world. Whether it be upstream, midstream or downstream, there are standard practices and routine maintenance procedures that must be conducted. Scheduled shutdowns, for example, mean that production is paused so that maintenance teams can inspect machines based on manufacturer-recommended schedules (even if the machines are in perfect working condition). If something happens in the period of time between those planned inspections, we firefight.
Definition: The term “Maintenance Cost” is defined as the value of a fixed asset net of all accumulated depreciation that has been recorded against it. In a broader economic sense, the depreciated cost for industry is the aggregate amount of capital that is "used up" in a given period, such as a fiscal year. This value can be examined for trends in capital spending and accounting aggressiveness, which can be useful in assessing competitive profiles. It is also known as the "salvage value," "net book value," or "adjusted cost basis.“
Inventory that is sold appears in the income statement under the COGS account. The beginning inventory for the year is the inventory left over from the previous year that is, the merchandise that was not sold in the previous year. Any additional productions or purchases made by a manufacturing or retail company are added to the beginning inventory. At the end of the year, the products that were not sold are subtracted from the sum of beginning inventory and additional purchases. The final number derived from the calculation is the cost of goods sold for the year.
Oil & Gas company are affected by periodic charges for depreciation, depletion, and amortization (DD&A) of costs relating to expenditures for the acquisition, exploration, and development of new oil and natural gas reserves. They include the depreciation of certain long-lived operating equipment, the depletion of costs relating to the acquisition of property or property mineral rights, and the amortization of tangible non-drilling costs incurred with developing the reserves.
Definition: The term “Cost of Goods Sold” is defined as the direct costs attributable to the production of the goods sold in a company. This amount includes the cost of the materials used in creating the good along with the direct labor costs used to produce the good. It excludes indirect expenses, such as distribution costs and sales force costs.
Upstream oil and gas industry products oil, natural gas, and natural gas liquids can be measured as barrels of oil equivalent (BOE), allowing for the comparison of unit prices and costs. Gross margin is defined as revenue minus cost of goods sold (COGS) divided by revenue, which can be translated into per-BOE values.
Definition: The term “Operating Expense” is defined as the is an expense a business incurs through its normal business operations. Often abbreviated as OPEX, operating expenses include rent, equipment, inventory costs, marketing, payroll, insurance, and funds allocated for research and development. One of the typical responsibilities that management must contend with is determining how to reduce operating expenses without significantly affecting a firm's ability to compete with its competitors.
The oil and gas sector plays an important role in the economy by drilling, extracting, and processing oil and gas. Because operating expenses vary widely with the size of oil and gas companies, average operating expenses tend to be meaningless. Financial professionals typically assess the average operating expenses by looking at the average operating expenses margin, which is expressed as the percentage of operating expenses in the sector's total revenues. In July 2015, the average operating expenses margin for the oil and gas industry was approximately 33%. Given the average revenue of $60 billion over the last four quarters, the average operating expense in the oil and gas sector stands at approximately $19.5 billion per company.
Definition: The term “Gross Sales Growth Rate” is defined as the percentage change of Gross Sales within a specific time period and given a certain context. For investors, growth rates typically represent the compounded annualized rate of growth of a company's revenues, earnings, dividends or even macro concepts, such as gross domestic product (GDP) and sales. Expected forward-looking or trailing gross sales growth rates are two common kinds of growth rates used for analysis. At their most basic level, Gross Sales growth rates are used to express the annual change in Sales growth as a percentage.
Definition: The term “Selling Expenses” is defined as a cost incurred to promote and market products to customers. These costs can include anything from advertising campaigns and store displays to delivering goods to customers. Any expense that is associated with selling a good or making a sale is considered a selling expense. Selling expenses are traditionally listed before general and administrative expenses because investors and creditors are typically more concerned about the costs related to producing income. General and admin expenses are still important, but they don’t actually produce any sales.
Selling expenses are categorized as indirect expenses on a company’s income statement because they do not contribute directly to the making of a product or delivery of a service. Some components can change as sales volumes increase or decrease, while others remain stable. Hence, selling expenses are considered to be semi-variable costs (as opposed to fixed or variable costs).
Definition: The term “General & Admin Expenses” represent the necessary costs to maintain a company's daily operations and administer its business, but these expenses are not directly attributable to the production of goods and services. Information on this type of expense is especially useful when calculating a company's fixed costs.
General & Admin expenses typically refer to expenses that are still incurred by a company, regardless of whether the company produces or sells anything. This type of expense is shown on the income statement, typically below cost of goods sold (COGS) and lumped with selling expenses, forming a selling, general and administrative expense line item.
There has been continuous focus to streamline the General & Admin Expenses in the Oil & Gas Upstream companies as these type of expenses rose over the time frame other than significant increase in the production as well as development costs. General & Admin Expenses can be either Support related (HR, Head office, administration, accounting etc.) or Technical and/or Operating types like exploration, development or EHS related costs etc.
Definition: The term “Interest Expense” is defined as the cost incurred by an entity for borrowed funds. Interest expense is a non-operating expense shown on the income statement. It represents interest payable on any borrowings bonds, loans, convertible debt or lines of credit. It is essentially calculated as the interest rate times the outstanding principal amount of the debt. Interest expense on the income statement represents interest accrued during the period covered by the financial statements, and not the amount of interest paid over that period. While interest expense is tax-deductible for companies, in an individual's case, it depends on his or her jurisdiction and also on the loan's purpose.
Definition: The term “Cash Flow” is the net amount of cash and cash equivalents being transferred into and out of a company. Positive cash flow indicates that a company's liquid assets are increasing, enabling it to settle debts, reinvest in its business, return money to shareholders and pay expenses. Cash flow is reported on the cash flow statement, which contains three sections detailing activities. Those three sections are cash flow from operating activities, investing activities and financing activities.
The number one measure of performance in oil and gas producers is core Cash Flow. This allows for increased certainty in meeting debt obligations (the oil industry generally carries larger levels of debt). Future cash flows also help to value a company on a monthly or yearly basis. Oil and gas reports a very high level of costs associated as non-cash items. Depreciation, depletion and amortization coupled with a large amount of deferred taxes are good reasons to use cash flow as the dominant measure for success and not net income. Commodity prices can move up or down significantly in a short period of time. Weather, inventories, and supply and demand can all affect pricing
Definition: The term “Income” is money (or some equivalent value) that an individual or business receives in exchange for providing a good or service or through investing capital. Income is used to fund day-to-day expenditures. In businesses, income can refer to a company's remaining revenues after paying all expenses and taxes. In this case, income is referred to as "earnings.” Most forms of income are subject to taxation.
The oil and gas, income is generally a royalty. Unless you are the owner of a large oil and gas corporation, your oil and gas income is generally from a royalty, which is a percentage of the total income that you receive when resources are extracted from your property or from a mineral right in which you own an interest. Some areas, such as the eastern half of Ohio, contain hydrocarbon deposits, which are oil and natural gas. When a property contains these natural resources, a contracted oil production company will drill and extract these resources.
Definition: The term “Interest Expense” is defined as the cost incurred by an entity for borrowed funds. Interest expense is a non-operating expense shown on the income statement. It represents interest payable on any borrowings bonds, loans, convertible debt or lines of credit. It is essentially calculated as the interest rate times the outstanding principal amount of the debt. Interest expense on the income statement represents interest accrued during the period covered by the financial statements, and not the amount of interest paid over that period. While interest expense is tax-deductible for companies, in an individual's case, it depends on his or her jurisdiction and also on the loan's purpose.
Definition: The term “Cash on Hand” is defined as Funds that are immediately available to a business, and can be spent as needed, as opposed to assets that must be sold to generate cash. The amount of cash on hand determines what projects a company can undertake, or what financial hardships can be absorbed, without going into debt or arranging other financing.
The Current ratio is a liquidity ratio used to determine a company's financial health. The metric illustrates how easily a firm can pay back its short obligations all at once through current assets. A company that has a current ratio of one or less is generally a liquidity red flag. This doesn't mean the company will go bankrupt tomorrow, but it also doesn't bode well for the company, and may indicate that it could have an issue paying back upcoming obligations.
The Quick ratio measures a company's ability to use its cash on hand or assets to extinguish its current liabilities immediately. Quick assets include assets that presumably can be converted to cash at close to their book values. A company with a Quick Ratio of less than 1 cannot currently pay back its current liabilities
Definition: The term “Gross Profit” is the profit a company makes after deducting the costs associated with making and selling its products, or the costs associated with providing its services. Gross Profit will appear on a company's income statement and can be calculated by subtracting the cost of goods sold (COGS) from revenue (sales). These figures can be found on a company's income statement. Gross profit assesses a company's efficiency at using its labor and supplies in producing goods or services. The metric only considers variable costs that is, costs that fluctuate with the level of output.
Typically, gross profit margin does not account for other costs such as energy, chemicals/catalysts, labor, materials, or fixed costs. However, sometimes the fuel generated by the refinery will be included in the product value in gross profit, margin and then also included in the energy cost when calculating variable cash margin. This has the effect of inflating the gross profit margin measure. Gross profit margin is the metric most useful in assessing the direct effect of market conditions on refinery economics, separate from the effects of operational performance.
Definition: The term “Net Cash” is the final amount of a company's total cash minus total liabilities reported on financial statements. It is commonly used in evaluating a company's cash flows. Net cash also refers to the amount of cash remaining after a transaction has been completed and all associated charges and deductions have been subtracted. Net cash may also be considered the short form when referring to net cash per share as it relates to stock investing. The term can be modified to distinguish the function of the funds, such as net cash flow, which describes incoming funds received within a period. Investors can use net cash to help determine whether a company's stock is an attractive investment, and it may be used in conjunction with other measures to gauge the company's overall liquidity.
Net cash flow is basically revenue minus costs. The most commonly used model in the oil and gas industry to determine profit is the NCF model since this model incorporates the time value of money. Profit in the cash-flow model is also referred to as net cash flow (NCF). The NCF model has one unique feature and this unique piece is called time zero.
Time zero is the day that the check is written to the contractors to perform a job. CAPEX is placed in time zero in the NCF model. It is very important that the cash-flow model is used for economic analysis, since it incorporates the time value of money. Profit excluding investment is referred to as operating cash flow.
Definition: The term “Net Cash Burn” is the rate at which a company is losing money. It is calculated by subtracting its operating expenses from its revenue. It is also usually stated on a monthly basis. It shows how much cash a company needs to continue operating for a period of time. However, one factor that needs to be controlled is the variability in revenue. A fall in revenue with no change in costs can lead to a higher burn rate.
Higher Net Cash Burn suggests that a company is depleting its cash supply at a faster rate. It indicates that is it at a higher likelihood of entering a state of financial distress. This may suggest that investors will need to more aggressively set deadlines to realize revenue given a set amount of funding. Alternatively, it would mean that investors would be required to inject more cash into a company for it to realize revenue.
It is true that capital expenditures are the main reason that Free Cash Flow go deeply negative for so many companies in recent years. When oil prices were $100 a barrel, oil companies invested every penny they could get their hands on into producing more oil. There were no guarantees of how long the high prices would last, but it’s understandable why they were plowing all their cash back into their business.
Definition: The term “Asset” is a resource with economic value that a corporation or country owns or controls with the expectation that it will provide a future benefit. Assets are reported on a company's balance sheet and are bought or created to increase a firm's value or benefit the firm's operations. An asset can be thought of as something that, in the future, can generate cash flow, reduce expenses, or improve sales, regardless of whether it's manufacturing equipment or a patent.
An Asset represents an economic resource for a company or represents access that other individuals or firms do not have. A right or other access is legally enforceable, which means economic resources can be used at a company's discretion, and its use can be precluded or limited by an owner. For an asset to be present, a company must possess a right to it as of the date of the financial statements. An economic resource is something that is scarce and has the ability to produce economic benefit by generating cash inflows or decreasing cash outflows.
Oil company assets are classified into three main divisions: upstream, midstream and downstream. Upstream operations are the exploration for oil and gas and the appraisal, development and production of any discovery, and most oil companies do not own equipment for upstream activities; they hire contractors to perform services such as geophysical surveys, well drilling and geological and environmental studies. Midstream assets are linked to the initial processing, storage and transportation of oil and gas. Crude oil refining into products such as gasoline, kerosene and diesel is a downstream activity, as is the product distribution to and marketing by a retail network.
Definition: The term “Liability” in general, is an obligation to or something that you owe somebody else. Liabilities are defined as a company's legal financial debts or obligations that arise during the course of business operations. Liabilities are settled over time through the transfer of economic benefits including money, goods, or services. Recorded on the right side of the balance sheet, liabilities include loans, accounts payable, mortgages, deferred revenues, and accrued expenses.
A liability is an obligation between one party and another not yet completed or paid for. A financial liability is also an obligation but is more defined by previous business transactions, events, sales, exchange of assets or services, or anything that would provide economic benefit at a later date. Liabilities are usually considered short term (expected to be concluded in 12 months or less) or long term.
Environmental liabilities are legal obligations arising under laws designed to protect human health and the environment. E&P has historically received favorable treatment under U.S. federal and state environmental remediation laws. Wastes generated during the exploration, development, and production of crude oil, natural gas, and geothermal energy are exempt from federal hazardous waste regulations under the Resource Conservation and Recovery Act. Significant liabilities may stem from sudden and accidental releases such as the Gulf Oil Spill, the lion’s share of E&P environmental liabilities are decommissioning, plugging and abandonment obligations incurred in the normal course of operations.
Definition: The term “Working Capital Ratio” is a measure of liquidity, revealing whether a business can pay its obligations. The ratio is the relative proportion of an entity's current assets to its current liabilities, and shows the ability of a business to pay for its current liabilities with its current assets. A working capital ratio of less than 1.0 is a strong indicator that there will be liquidity problems in the future, while a ratio in the vicinity of 2.0 is considered to represent good short-term liquidity.
The working capital ratio can be misleading if a company’s current assets are heavily weighted in favor of inventories, since this current asset can be difficult to liquidate in the short term. This problem is most obvious if there is a low inventory turnover ratio. A similar problem can arise if accounts receivable payment terms are quite lengthy (which may be indicative of unrecognized bad debts).
The degree of working capital tied up by the oil and gas industry has grown substantially over the past six years. Working capital among oil and gas companies in terms of cash-to-cash (C2C) grew from 24.9 to 32.0 days, an increase of 7.1 days or 29 percent between 2003 and 2009. While the expansion of the industry-wide C2C cycle was driven by 20 of the 34 companies surveyed, the difference between the best performers and laggard performers is considerable.
Definition: The term “Debt Ratio” is a financial ratio that measures the extent of a company’s leverage. The debt ratio is defined as the ratio of total debt to total assets, expressed as a decimal or percentage. It can be interpreted as the proportion of a company’s assets that are financed by debt. A ratio greater than 1 shows that a considerable portion of debt is funded by assets. In other words, the company has more liabilities than assets. A high ratio also indicates that a company may be putting itself at a risk of default on its loans if interest rates were to rise suddenly. A ratio below 1 translates to the fact that a greater portion of a company's assets is funded by equity.
Oil and gas operations are very capital-intensive, yet most oil and gas companies carry relatively small amounts of debt, at least as a percentage of total financing. This can be seen in debt ratios. It is not that all oil companies are involved in the same operations. A company's position along the supply chain influences its Debt ratio. Debt Ratio reflects the degree to which a company is leveraged. In other words, it shows how much of the company's financing results from debt as opposed to equity. Generally speaking, higher ratios are worse than lower ratios, though these higher ratios may be more tolerable for large firms or certain industries.
Definition: The term “Liquidity Ratio” is defined as an important class of financial metrics used to determine a debtor's ability to pay off current debt obligations without raising external capital. Liquidity ratios measure a company's ability to pay debt obligations and its margin of safety through the calculation of metrics including the current ratio, quick ratio, and operating cash flow ratio.
Current liabilities are analyzed in relation to liquid assets to evaluate the coverage of short-term debts in an emergency. Liquidity is the ability to convert assets into cash quickly and cheaply. Liquidity ratios are most useful when they are used in comparative form. This analysis may be internal or external. For example, internal analysis regarding liquidity ratios involves using multiple accounting periods that are reported using the same accounting methods. Comparing previous time periods to current operations allows analysts to track changes in the business. In general, a higher liquidity ratio shows a company is more liquid and has better coverage of outstanding debts.
If there is one lesson to be learned from the deep drop in oil prices over the past year, it's that liquidity matters. A key difference between the average oil stock and Approach Resources, Carrizo Oil & Gas, and Penn West Petroleum is that the trio have the most dangerous liquidity ratios among this sector,
Definition: The term “Leads Created” is the marketing process of stimulating and capturing interest in a product or service for the purpose of developing sales pipeline. Lead creation often uses digital channels, and has been undergoing substantial changes in recent years from the rise of new online and social techniques. In particular, the abundance of information readily available online has led to the rise of the “self-directed buyer” and the emergence of new techniques to develop and qualify potential leads before passing them to sales.
In a perfect world, the company would send a message and consumers and businesses would hear it, then flock to you with checkbooks in hand. Unfortunately, that’s not the way the sales process works in the real world. Before a transaction occurs, your company has to go through a process of generating familiarity, trust, and interest in your products and services. You have to generate new leads, then move them through the sales funnel. The sales funnel for oil and gas companies is often a long one.
You need to show what you have to offer, and if it matches what a potential client is looking for, they’ll consider starting negotiations. It can be a long process, but the result is a mutually beneficial partnership. But before you can begin to move clients through the sales funnel, you need to open the lines of communication a process called lead creation or generation.
Definition: The term “Opportunities Won” is the stage of the sales funnel in which a contact has inked the deal and become a customer. In other words, an opportunity that had a certain percentage possibility of becoming a closed deal at the start of the funnel is now 100% certain to end with a sale. It’s opposite, the closed-lost opportunity, is where contact with the sales prospect has been terminated, and there is now a 0% chance of a sale. While, of course, the closed-won opportunity represents the successful end stage of a sales cycle, there are elements and techniques that lead to a close won deal. When teams are prospecting sales whether attempting to cold-call new sales prospects or cultivating old leads closed-won deals are likely when they use more than one team member and establish strong connections through repeat communications.
Definition: Open Deals provide a finer focus for promotional activities. Example a Sales Promotion includes separate sales deals for each product line. Within the sales deal for a product line you might want to be able to promote the products in different ways. You might, for example, want to offer customer-specific discounts in some cases and material-based discounts in others. You can then create specific condition records that are linked to the sales deal, or assign existing condition records. If the sales deal is linked to a promotion, the condition record also contains the number of the promotion. This makes it possible later on, for example, to list and analyze all the condition records that refer to a particular promotion
The term Customer Churn Rate refers to the percentage of customers who discontinue subscribing to a service within a given period. In other words, Customer Churn Rate means the loss of a customer. A churn will always occur regardless of the quality of customer service provided by a business because there are unforeseeable circumstances that could impact a customer’s decision to no longer do business with you. Nevertheless, a high churn rate negatively impacts the revenue and decision-making process of a business.
Customer Churn Rate is a critical KPI for businesses for the following reasons:
Companies concerned with customer churn often distinguish between “gross” versus “net” Customer Churn Rate. Gross Customer Churn Rate is the rate at which a company is losing customers. Net Customer Churn Rate measures the difference between the Gross Customer Churn Rate and New Customer Acquisition Rate.
Due to the importance of keeping Customer Churn Rates down, subscription-based companies often have departments dedicated to engaging and improving relations with unsatisfied customers or winning back lost customers.
Sentiment Analysis is the automated process of understanding an opinion about a given subject from written or spoken language. The retail world generates approximately 2.5 quintillion bytes of data every day. Sentiment analysis allows one to understand the vast amounts of information from review sites, forums, social media, and blogs.
Sentiment analysis uses algorithms that evaluate certain words to determine if they are positive, negative, or neutral. It is used by the majority of social media monitoring tools such as Social Mention (which has recently been shut down) or Brand24 Determining the emotional tone of a message is a challenging task for the majority of software analytic tools. Currently, sentiment analysis lacks the sophistication to evaluate sarcasm or the subtle content of posts.
Customer Segmentation is the process of dividing customers into groups based on their common characteristics so companies can market to each group effectively and appropriately. With customer segmentation, marketers can better tailor their marketing efforts to various audience subsets. Those efforts can relate to both communications and product development.
Customer segmentation requires a company to analyze customers and to identify patterns and information about them, such as job titles, geography, or products purchased. Gleaning information about a customer is determined by how they enter your system. An online marketer working from an opt-in email list might segment marketing messages according to the opt-in offer that attracted the customer, for example. Other types of information, such as marital status, age, and demographics, however, must be acquired in a different way.
All online and in-person businesses, regardless of their size, industry categorization can use customer segmentation. The first step of customer segmentation is to gather and analyze information. The second step is to act on that information effectively and appropriately. Common characteristics in customer segments can guide how companies market to individual segments and what products and services to offer.
Brand Awareness is the extent to which consumers recognize distinct qualities or image of a specific brand of goods or services. The key performance indicators of branding include brand awareness, brand recall, brand traffic, and brand recognition. Creating brand awareness is critical to promoting a new product or reviving an old brand. Ideally, awareness of a brand may include recognizing qualities that distinguish it from its competitors. Maintaining a high level of brand awareness of products and services will likely generate more sales. Customers confronted with many product choices will likely choose a brand named product as opposed to one that is unfamiliar.
Brand Recall Traffic refers to the number of customers who correctly elicit a brand name from memory. Since it is an excellent indicator of brand strength, marketers should consider using it as a KPI. Knowing how a brand drives its traffic in the online arena is critical information for a digital marketer. It is essential to realize that one cannot connect the value of a brand with the direct traffic metric since many usually search for a brand name via search engines as well as other means
Brand Recognition is the ability of a consumer to correctly identify a particular product over others by its logo, tagline, packaging or advertising campaign. An audio cue such as a jingle or theme song associated with a brand can trigger brand recognition. Brand recognition requires the consumer to recall prior knowledge. To build brand recognition, an organization must repeatedly provide consumers with a consistent visual or auditory learning experience. Television advertising is masterful at promoting brand recognition.
An omnichannel also spelled omni-channel is a multichannel approach to sales that seeks to provide customers with a seamless shopping experience, whether they're shopping online from a desktop or mobile device, by telephone, or in a brick-and-mortar store. An omnichannel approach is the integration between distribution, promotion, and communication on the back end.
For example, a brick and mortar store representative can immediately reference a customer’s previous purchases and preferences just as easily as a phone or web chat customer service representative. Or the customer can use a desktop computer to check inventory by store on the company's website, buy the item later with a smart phone or tablet, and pick it up at a chosen location.
As a category of multichannel, omnichannel is built on multiple methods of promoting and distributing products, such as physical stores, websites and mobile apps, and means of allowing customers to reach out with problems or concerns by phone, email, web chat, and social media.
Market Basket is a modeling technique based upon the theory that if one buys a certain group of items, one may or may not buy another group of items. For example, someone at an English pub may buy a pint of beer and not a bar meal. That person is likely to purchase crisps (US. chips) at the same time that somebody who did not buy beer. Itemset refers to the set of items that a customer buys. Market basket analysis seeks to find the relationship between purchases.
Support for the Rule is the probability that a customer will buy a beer without a bar meal. Confidence is the conditional probability that a customer will purchase crisps. In retail, most consumers purchase on impulse. Market basket analysis supplies clues about which item(s) a customer might have purchased.
Target market is a group of customers that a firm plans to reach with marketing efforts. Target marketing can identify customers by a brand, product, location, sales, or marketing strategy. Target marketing also refers to a specific group of customers who are the focus of a company's advertisements. Television, movies, audio, and print are some of the media channels of target marketing.
Target customers are critical in a company's marketing and advertising plans. Companies design their advertising campaigns around specific target attributes. Understanding a target audience is the means of creating focused ads that convert an audience into customers.
Although it is impossible to target everyone, it is possible to sell to everyone. A target market audience must be the result of research, not a gut feeling. Learn as you go. Adapt on the fly. Pursue those who want to purchase from you. Do not worry if they were your original target audience.
Moving a business is expensive. From the beginning, it is important to analyze its location to avoid moving problems. Conducting initial research and analysis is important when investigating retail space, whether it is a small boutique or a large superstore like Wal-Mart.
A retailer with an excellent location has a strategic advantage over similar retailers. A product or service that sells like hotcakes in one area may not sell nearly as well in another location. Or, it may not sell at all. With the advent of technology, online shopping, and next day delivery, proper analysis is even more vital to successfully opening a brick and mortar retail store. To determine a location, it is essential evaluate the following:
Inventory Management measures how fast merchandise sells in the marketplace. The term Fast-Moving Inventory is merchandise that sells within a couple of days and does not hold inventory storage space for long. It has a short shelf life because of high consumer demand such as soda pop and confections or because they perish quickly. Examples include meat, dairy products, and baked goods. These stocks are purchased frequently are consumed rapidly are priced low, and are sold in large quantities. They also have a high turnover when they are on the shelf at the store.
Fast-moving inventories are purchased for consumption by the average consumer. They are divided into three different categories: durable, nondurable goods, and services. Durable goods have a shelf life of three years or more while nondurable goods have a shelf life of less than one year. They are consumed immediately. Nearly everyone in the world uses fast-moving inventories every day.
Slow-Moving Inventory is a merchandise locked up in the store’s space with a low sales rate and inventories greater than three months. It is also defined as Stock Keeping Units (SKU) that have not shipped in a certain amount of time such as 90 or 180 days; the merchandise has a low turnover rate relative to the quantity on hand. Slow-moving inventories not only vary from seller to seller, they vary from item to item.
Sales flash is a short-term discount or promotion of products offered by e-commerce stores, typically lasting 24 hours or less. The quantity is limited, which often means the discounts are higher or more significant than run-of-the-mill promotions. The time limit and limited availability entice consumers to buy on the spot - aka impulse buying. While any e-commerce store can use flash sales as a valuable promotional marketing tactic, some companies' entire business models leverage flash sales.
Sales Flash is a highly effective strategy to unload excessive merchandise. While consistently selling products is ideal, it is impossible to plan inventory that perfectly matches the buying needs of customers. Flash sales are a great way to sell items that are either out of season or stashed in catalogs for a long time. Unloaded, excessive merchandise leads to lower operating and inventory costs on the back end. Selling products that have been sitting in a warehouse for a long or even a short period of time can make room for newer inventory that sells quickly.
Retail Payments usually involve transactions between two consumers, between two consumers and businesses, or between two businesses. Businesses typically make wholesale payments. There is no definitive division between retail and wholesale payments. However, retail payment systems usually involve higher transaction volumes and lower average dollar values than those of wholesale payment systems. Purchase of Goods and Services-Purchase of goods and services occur at the Point-of-Sale (POS). This type of transaction can occur in person, at a merchant location, through the Internet, or by telephone. Increasingly, traditional retailers such as grocers and home improvement stores are using unattended payment systems at the POS as well. These payments include attended POS payment transactions for goods or services with traditional retailers, unattended payment transactions, and with vending machines.
Retail payment systems continue to evolve with advances in technology. These advances enable financial institutions to develop new products and services, lower the barriers to business entry for smaller institutions, and exploit economies of scale. Retail payment systems have evolved in many ways due to recent changes in payments technology. As firms seek economies of scale, the banking industry has witnessed the rapid consolidation of retail payment service providers, credit issuers, merchant acquirers, processing companies, and check processors.
Revenue typically refers to a company's revenue net of discounts and returns. Sometimes, users define revenue as a net profit, which is the sales net of all expenses. Generation of revenue is an important driver that influences the consumer industry. Even with a high generated income, industry still needs to adapt itself to the global market.
Revenues are sales or gross receipts that a company generates from fees it charges for services it renders or products it sells. These revenues are called “operating revenues” because they are derivatives from business of your company. The gains on a sale as well as earned assets on investments are non-operating revenues. Without them, a company must tap into other financing sources, which may include loans or equity to fund its activities.
Retail business incurs many costs, such as the cost of goods sold or services delivered. Raw materials, wholesale inventory, supplies, and direct labor are examples costs included in retail business. Retail generates operating expenses, or selling, general and administrative expenses. These include, but are not limited to, marketing, rent, utilities, salaries, training and meals, and entertainment. Additional costs include interest on any debt financing and income taxes.
A retail business, even one that is home-based or online, must incur these costs to deliver its products or services. As the owner or manager, you must pay people to perform duties that you either cannot or do not have time to do. You must market your business to find and attract customers. You must pay for the phone you use to call, the computer and Internet you use to write and connect. The only way your company will not incur costs is if it is dormant and not operating.
Profit margin is one of the commonly used profitability ratios to gauge the degree to which a company or a business activity makes money. It represents what percentage of sales has turned into profits., For instance, if a business reports that it achieved a 35% profit margin during the last quarter, it means that it had a net income of $0.35 for each dollar of sales generated.
Just as there are many types of retail establishments, there are different business models that call for different profit margins. Instead of determining a margin based on arbitrary industry averages, projecting reasonable profit goals in line with a profit margin is the preferred choice. The ability to raise margins hinges on the type of establishment one operates. After determining a profit goal, work backward the necessary margin to reach that goal.
A financial forecast is an estimate of future outcomes for a business. An income statement is a financial statement that shows a company's revenues and expenses during a particular period.
A complete financial forecast includes a balance sheet, statement of cash flows and an income statement.
You will learn how to financially forecast by completing the income statement model from revenue to operating profit or EBIT. There are inherent tensions in model building, making your model realistic, and keeping it simple and robust. The first-principles approach identifies various methods to model revenues with high degrees of detail and precision. For instance, when forecasting revenue for the retail industry, forecasting the expansion rate and deriving income per square meter is the objective.
When forecasting revenue for the consumer industry, you predict the market size and use current market share and competitor analysis. When forecasting revenue for any service industries, you estimate the headcount and use the income for employee trends.